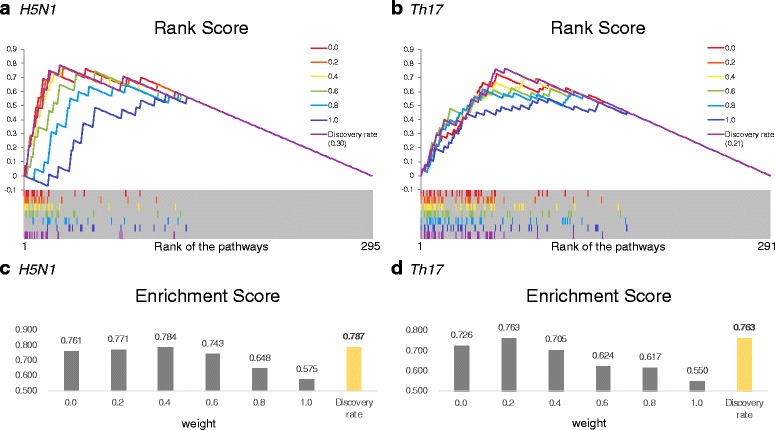
Fig. 4.

The result of pathway set enrichment analysis. a – b show PSEA results of H5N1 and Th17, respectively. The pathway list sorted by Score(π i,k) with various weights, from 0.0 to 1.0 increased by 0.2 and Discovery rate (0.30 and 0.21), is present in x-axis. The line graph shows Rank Score (R S(i)) of each rank i, changed through pathway list from the first rank to the last rank. Color marking in the bottom gray boxes means position of π ∗ in pathway list. c – d show Enrichment Score(ES) of each dataset, which is the maximum RS
