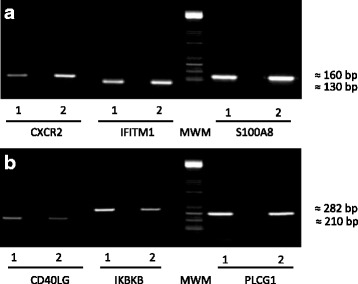
Fig. 5.

The microarrays were validated by using PCR reactions. Panel a depicts up-regulated genes and panel b down-regulated genes. Lane 1 represents the corresponding PCR amplification of the indicated gene from untreated mice and lane 2 represents the corresponding PCR amplification of the indicated gene from the immunised mouse group. Each mouse’s RNA was pooled and used for RT-PCR and the genes for validation were randomly assigned. The results are representative of three individual experiments. MWM: Molecular Weight Marker
