
Fig. 3.
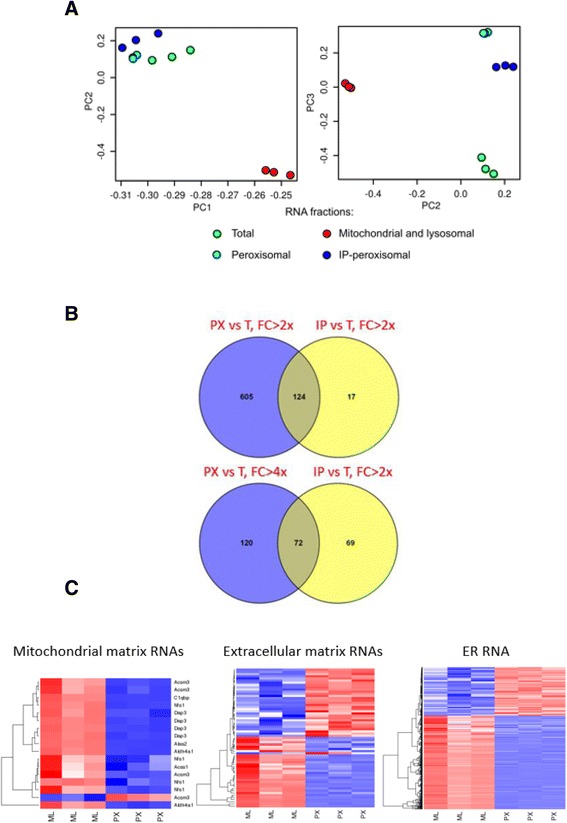
Microarray analysis of peroxisomal RNA. a Principal component analysis (PCA) of microarray data obtained from analyzing triplicate samples of total cellular RNA (T) and organellar fractions: mitochondrial/lysosomal (ML), peroxisomal (PX), peroxisomal additionally purified by immunoprecipitation (IP). b Venn diagrams demonstrating the numbers of common RNAs between those enriched in PX and IP fractions as compared to total cellular RNA (T) with different fold changes as indicated. c Hierarchical clustering of the RNAs more than 2-fold differentially over- or under-expressed in peroxisomes (PX), compared to the mitochondrial/lysosomal (ML) fraction; the RNAs are grouped by their annotated compartments (mitochondrial matrix, extracellular matrix, or encoplasmatic reticulum, ER); red color shows the magnitude of over-expression of a given RNA (in the rows of the diagrams) in a given sample (in the columns of the diagrams), the blue corresponds to the under-expression, and the white reflects lack of differences in the expression values across the samples