Fig. 6.

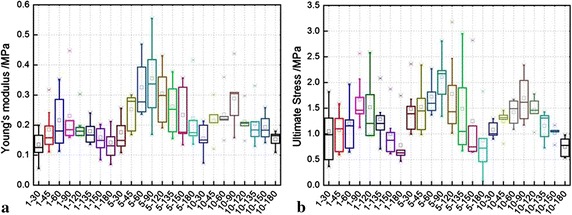
Influences of loading rates on the a Young’s modulus and b ultimate stress. Note the abscissa scale is displayed in the form of p–q the first number p represents loading rate (mm/min), and the second q represents samples’ angle (°)

Influences of loading rates on the a Young’s modulus and b ultimate stress. Note the abscissa scale is displayed in the form of p–q the first number p represents loading rate (mm/min), and the second q represents samples’ angle (°)