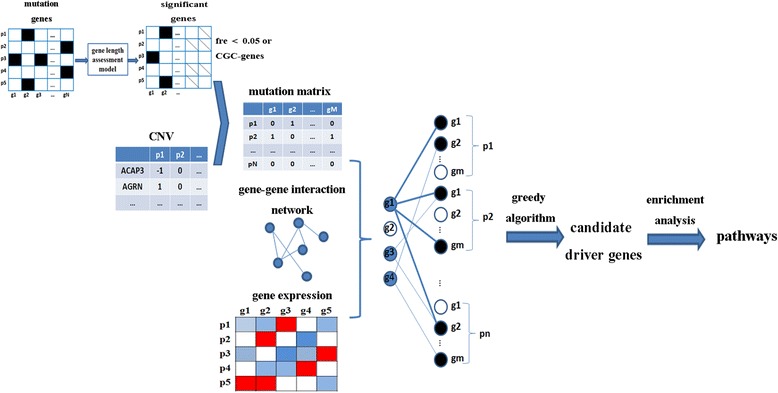
Fig. 1.

Schematic of the LNDriver. Genes in somatic mutations are firstly applied to GAM to filter long genes and then they will combine with CNV to construct mutation matrix. The bipartite graph is constructed based on mutation data, expression data and gene-gene influence network, where the blue nodes on the left bipartite graph represent the mutated gene and the black nodes on the right represent the outlying patient-gene events from the gene expression matrix. Then greedy algorithm is applied to identify candidate driver genes. Finally, enrichment analysis is employed to these candidates to explore their roles in pathways
