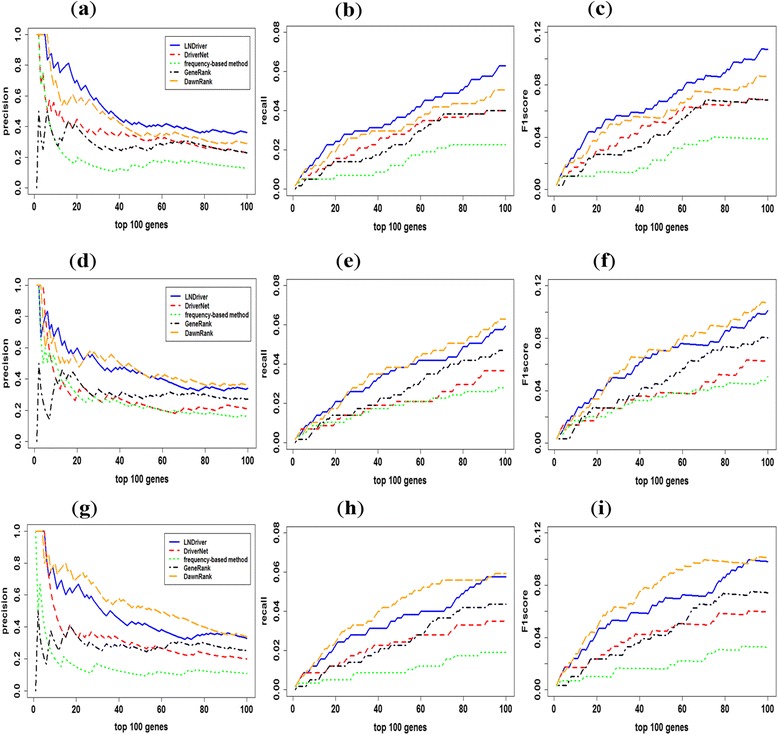
Fig. 2.

a HNSC precision. b HNSC recall. c HNSC F1score. d KIRC precision. e KIRC recall. f KIRC F1score. g THCA precision. h THCA recall. i THCA F1score. The comparison of precision, recall and F1score for top ranking genes in LNDriver and other methods. The X axis represents the number of top ranking genes and the Y axis represents the score of the precision, recall and F1score respectively
