
Fig. 3.
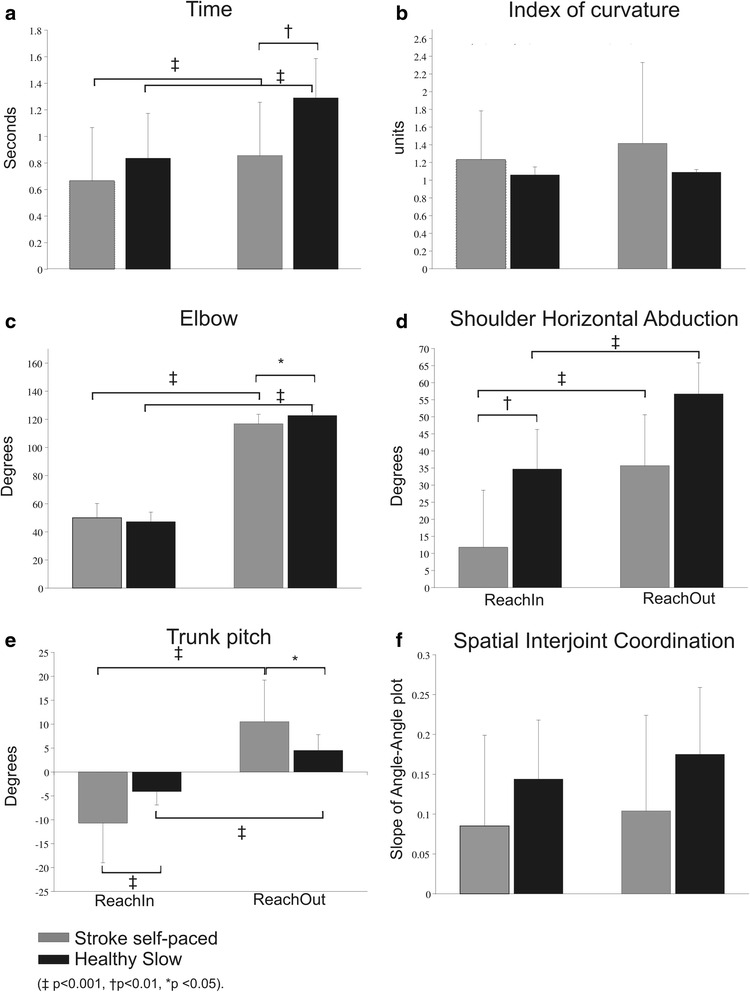
Histograms of main outcome variables; a Time to perform the task; b Index of curvature; c Elbow range of motion; d Shoulder horizontal abduction range of motion; e Trunk pitch; f Spatial interjoint coordination. Black/grey bars show means and standard deviations for healthy/stroke groups respectively