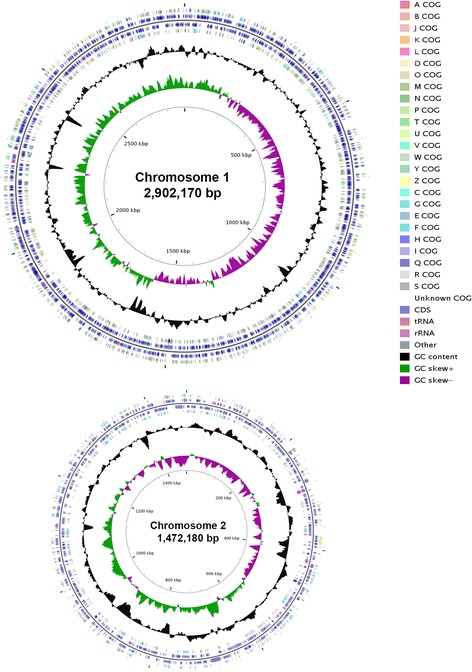
Fig. 3.

Graphical map showing only chromosomes of Yangia sp. CCB-MM3 generated with CGview comparison tool [44]. From outside to the center: genes identified by the COG on forward strand, CDS on forward strand, CDS on reverse strand, genes identified by the COG on reverse strand, RNA genes (tRNAs orange, rRNAs pink, other RNAs grey), GC content (black) and GC skew (purple/green)
