
Fig. 4.
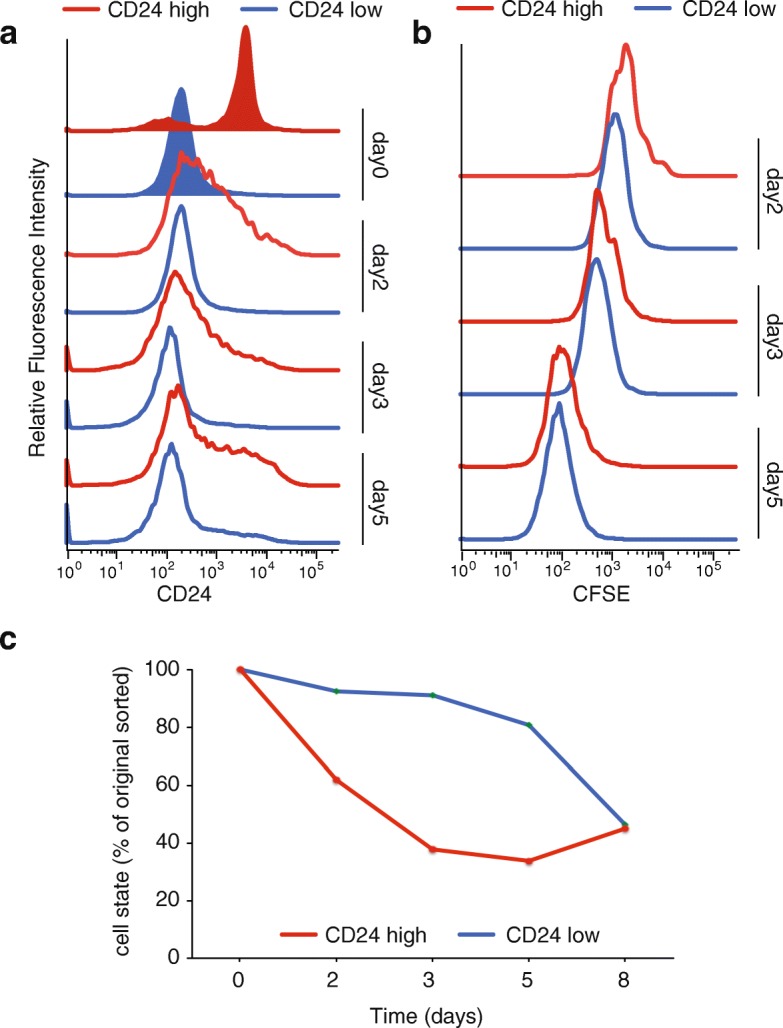
Epigenomic plasticity of K562 subpopulations. a FACS analysis of CD24 sorted K562 cells. Shown are the initial sort (tinted) and the flow cytometric re-analysis at days 2, 3, and 5. Blue indicates CD24lo sorted K562 cells, red CD24hi sorted population. b Proliferation analysis of K562 sorted subpopulations. After the initial sort CD24hi and CD24lo cells were stained with CFSE and then cultured for 8 days. CFSE fluorescence intensity was measured at days 2, 3, and 5 together with CD24 (a). c Quantification of the changes in CD24-expressing cells. Blue, CD24lo; red, CD24hi