
Fig. 3.
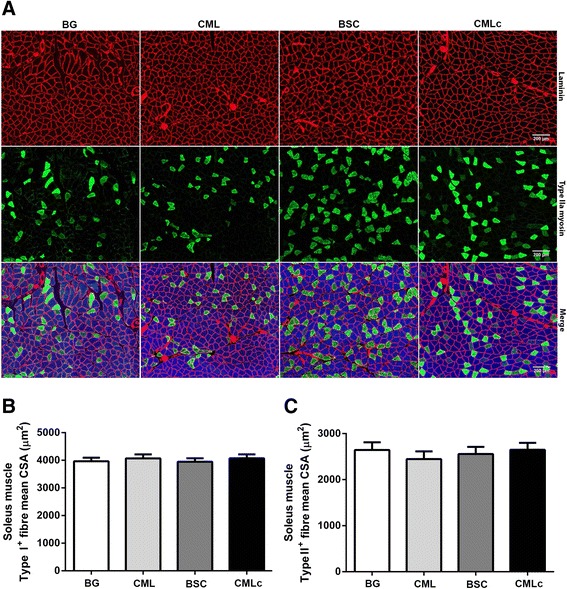
Soleus muscle myofibre cross-sectional area (CSA) (μm2) in rats supplemented with various milk fat globule membrane (MFGM) mixtures. a Representative images of soleus muscle cross-sections probed with mouse monoclonal antibodies against MyHCI (IgG2b, Alexa Fluor 350, blue), MyHCIIa (IgG1, Alexa Fluor 488, green), MyHCIIb (IgM, Alexa Fluor 555, red) and laminin (IgG2a, Alexa Fluor 647, far-red, pseudo coloured red). b Mean CSA (μm2) of soleus muscle Type I (MyHCI-positive) myofibres. c Mean CSA (μm2) of soleus muscle Type IIa (MyHCIIa-positive) myofibres