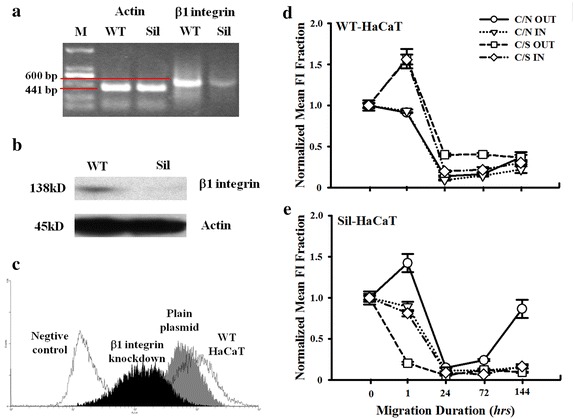
Fig. 2.

Alteration of β1 integrin expression on WT- and β1 integrin knockdown- HaCaT cell migration under coculture and mechanical stretch. a RT-PCR analysis of β1 integrin in WT- and silenced- (Sil-) HaCaT cells. Red lines indicated the molecular weight of the target fragments. b WB analysis of β1 integrin in WT- and Sil-HaCaT cells. c Comparison of β1 integrin expression between WT- (open bar) and Sil- (solid bar) HaCaT cells. WT-cells transfected via plain plasmid (grey bar) was used as control. d, e Time courses of β1 integrin expression in WT- (d) or Sil- (e) HaCaT cells under cocultured with fibroblasts and mechanical stretch. Data were presented as the mean ± standard error (SE) of normalized fluorescence intensity (FI) fold of totally >9 cells at the leading edge
