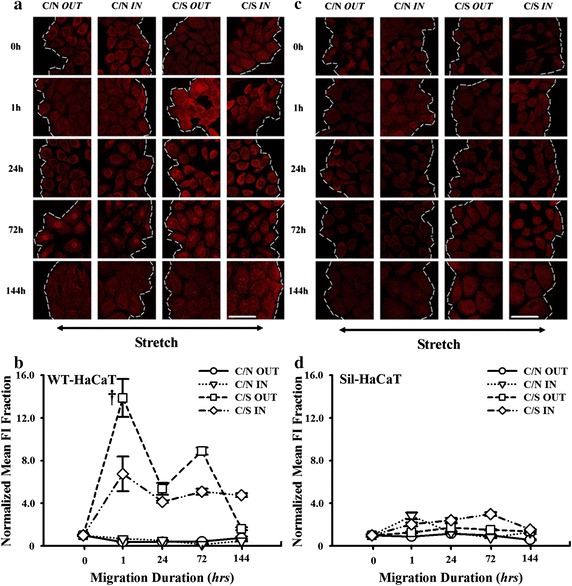
Fig. 5.

Expression of PI3K in WT- and Sil-HaCaT cells migration in four migration patterns at different time points. (a, b) IF images and time courses of PI3K expression in WT-HaCaT cells (a). Data were presented as the mean ± SE of normalized FI of totally >9 cells at the leading edge. †The level of statistical significance of difference in normalized mean FI at t = 1 h between C/S IN and C/S OUT patterns in WT-HaCaT cells (b). (c, d) IF images and time courses of PI3K expression in Sil-HaCaT cells (c). Data were presented as the mean ± SE of normalized FI of totally >9 cells at the leading edge (d). Scale bar 50 μm
