Fig. 2.

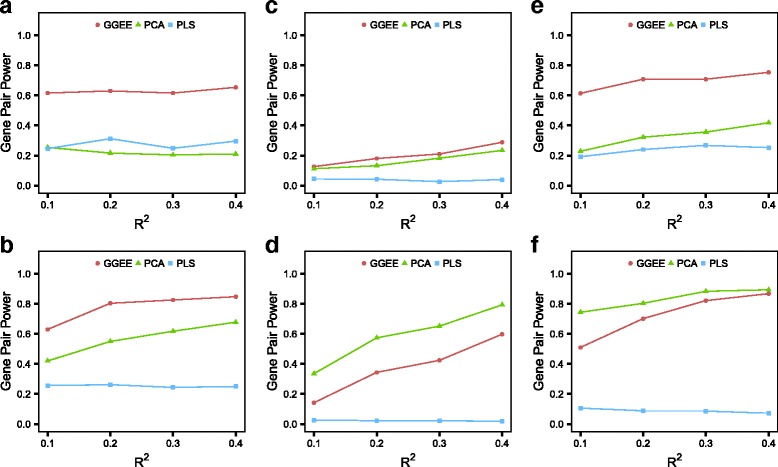
Power under a realistic context. The figures show the power to detect interaction effects of the three methods depending on R 2. The panels a, b, c, d, e and f refer to the different simulation settings described in Table 1

Power under a realistic context. The figures show the power to detect interaction effects of the three methods depending on R 2. The panels a, b, c, d, e and f refer to the different simulation settings described in Table 1