
Fig. 2.
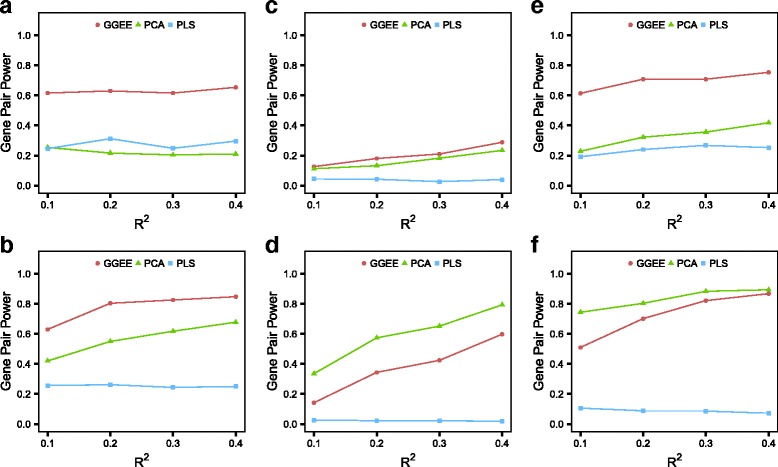
Power under a realistic context. The figures show the power to detect interaction effects of the three methods depending on R 2. The panels a, b, c, d, e and f refer to the different simulation settings described in Table 1
Official websites use .gov
A
.gov website belongs to an official
government organization in the United States.
Secure .gov websites use HTTPS
A lock (
) or https:// means you've safely
connected to the .gov website. Share sensitive
information only on official, secure websites.
Power under a realistic context. The figures show the power to detect interaction effects of the three methods depending on R 2. The panels a, b, c, d, e and f refer to the different simulation settings described in Table 1