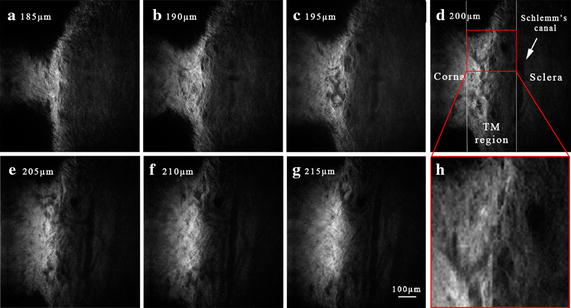
Fig. 3.

a–g SHG images of the TM region in an intact rat eye at different depths (from 185 µm to 215 µm with an interval of 5µm). As surface of eye was set to be 0 μm, a is the image closest to the surface and g is the image close to the innermost regions of TM. h is the image of amplified the red box in d with four times. Scale bar 100 μm
