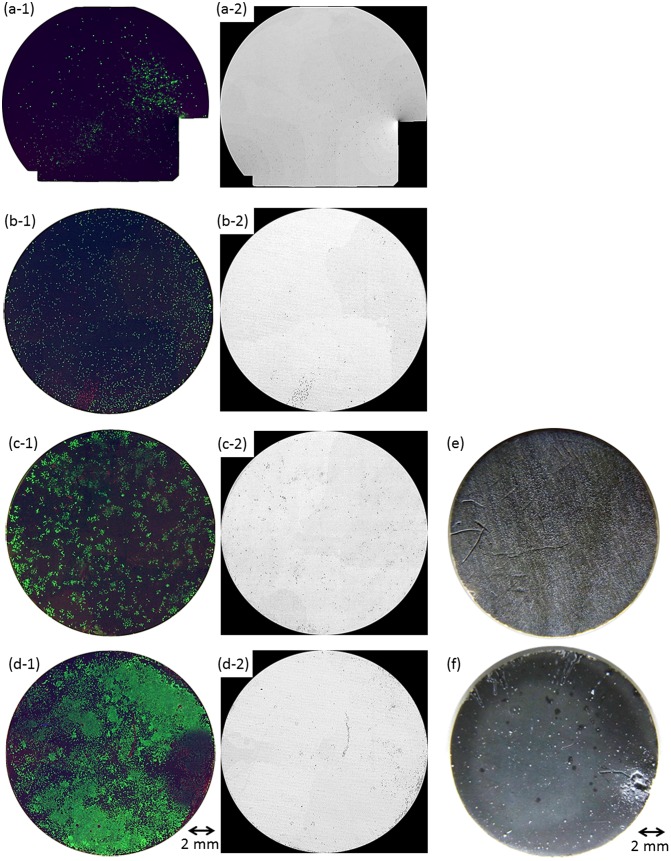
Figure 4.
Fluorescence images of MG-63 cells on the entire surface of (a, c) OCP- and (b, d) HAp-AZ31, cultured for (a, b) two days and (c, d) six days. Optical images of (e) OCP- and (f) HAp-AZ31 disks after culturing cells for six days. (a-1–d-1) composite images of calcein-, PI-, and Hoechst33342-stained cell images (living cells, green; dead cells, red; nuclei of both cells, blue), and (a-2–d-2) PI-stained images converted to monochrome image (dead cells, black).

