Figure 6.
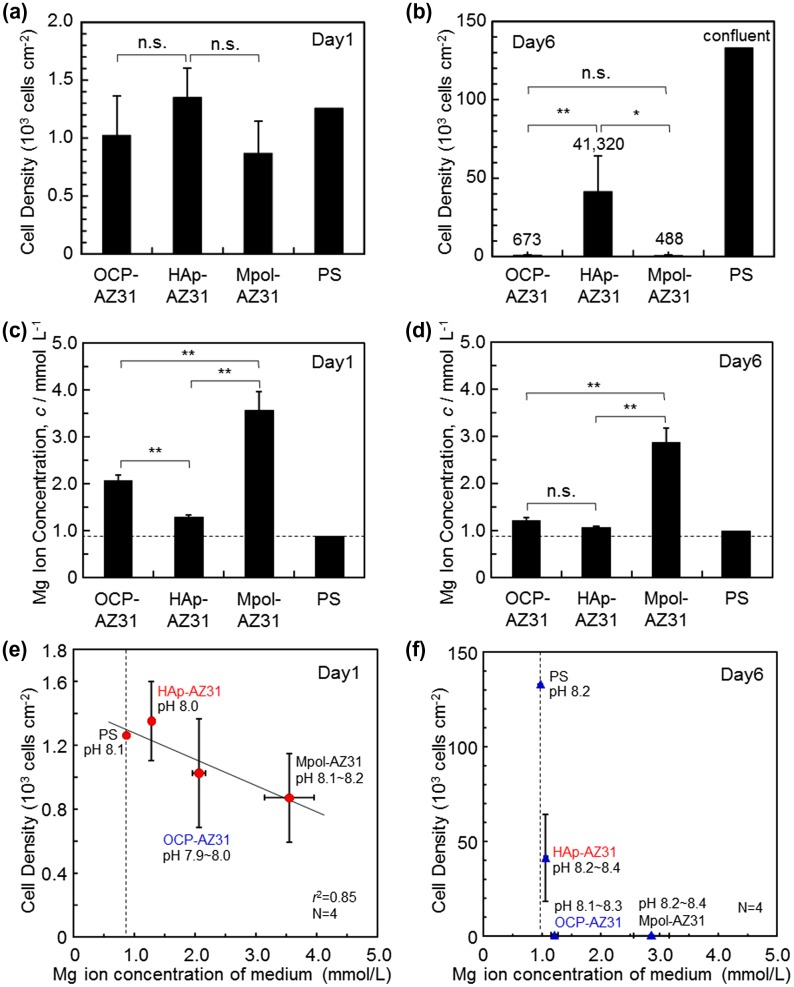
(a, b) Cell densities on OCP-, HAp- and Mpol-AZ31 and polystyrene (PS) dish at days 1 and 6. (c, d) Magnesium ion concentration of medium at days 1 and 6 used for cell culture on OCP-, HAp- and Mpol-AZ31 and PS. Dashed lines in (c) and (d) correspond to the original Mg2+ ion concentration of the medium. Cell density as a function of Mg2+ ion concentration in the medium at (e) day 1 and (f) day 6.

