Fig. 2.

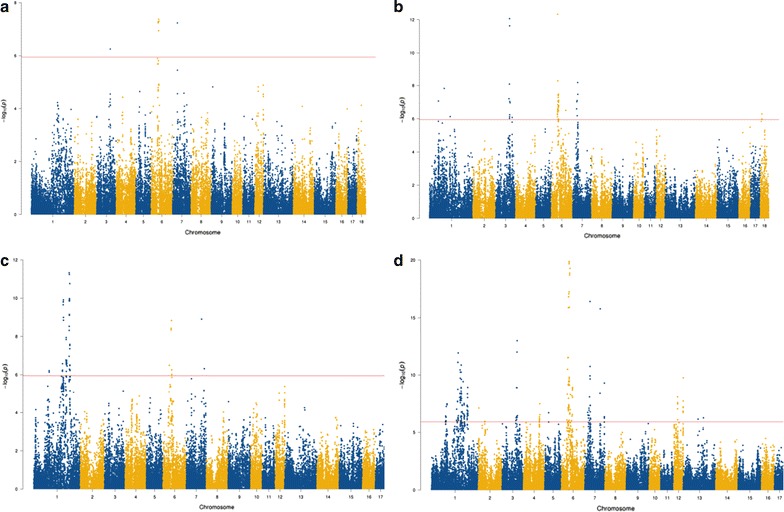
Manhattan plots of across-breed meta-analyses for a FRONT, b BACK, c HIND and d CONF. x-axis represents the chromosomes and y-axis represents . The red line indicates genome-wide significance threshold at P value <1.13 × 10⁻⁶

Manhattan plots of across-breed meta-analyses for a FRONT, b BACK, c HIND and d CONF. x-axis represents the chromosomes and y-axis represents . The red line indicates genome-wide significance threshold at P value <1.13 × 10⁻⁶