
Fig. 7.
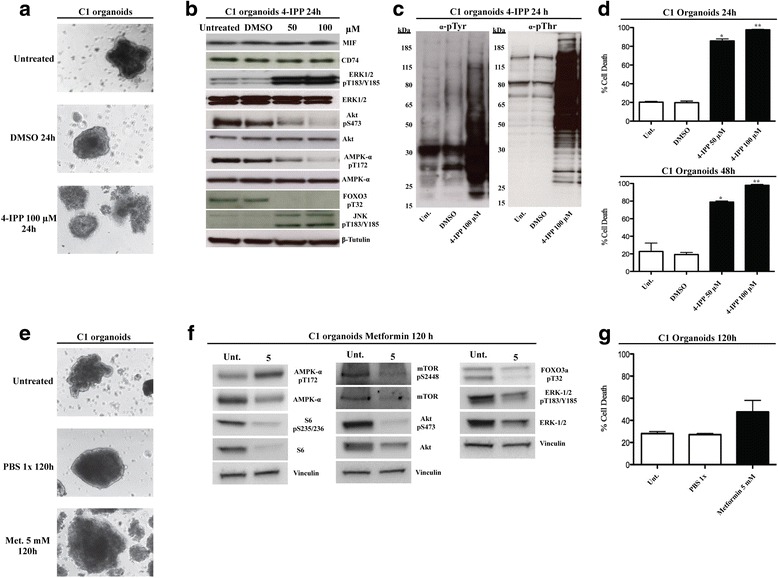
4-IPP and metformin effects are recapitulated using C1 organoids. a Micrographs of C1 organoids before and after 4-IPP treatments. 4-IPP treatment induced loss of the original spheroid organization. Magnifications: 10X. Scale bars = 50 μm. b Immunoblots of the principal proteins involved in CD74/MIF signaling pathway. C1 organoids were untreated or treated with 50 and 100 μM 4-IPP for 24 h; lysates were resolved by 4–12% SDS–PAGE and immunoblotted. c Immunoblots showing the expression and activity of the α-pTyr and α-pThr proteins before and after 4-IPP treatment. C1 organoids were untreated or treated with 50 and 100 μM 4-IPP for 24 h; lysates were resolved by 4–12% SDS–PAGE and immunoblotted. d C1 organoids were treated with 50 and 100 μM 4-IPP for 24 and 48 h. The percentage of cell death was determined by trypan blue exclusion assay. Data are expressed as the mean ± SD. *P < 0.01 compared with untreated control and 50 μM 4-IPP. **P < 0.01 compared with untreated control and 100 μM 4-IPP. All the experiments were replicated at least three times. e Micrographs of C1 organoids before and after metformin treatments. Metformin treatment induced a moderate loss of the original spheroids organization. Magnifications: 10X. Scale bars = 50 μm. f Immunoblots of the principal proteins involved in the metformin pathway. C1 organoids were treated with 5 mM metformin for 120 h; lysates were resolved by 4–12% SDS–PAGE and immunoblotted. Images are representative of the results from at least two experiments. g C1 organoids were treated with 5 mM metformin for 120 h. The percentage of cell death was determined by trypan blue exclusion assay. Data are expressed as the mean ± SD. We have not observed significant increase in the percentage of cell death after metformin treatments compared with untreated controls. All the experiments were replicated at least three times