
Fig. 1.
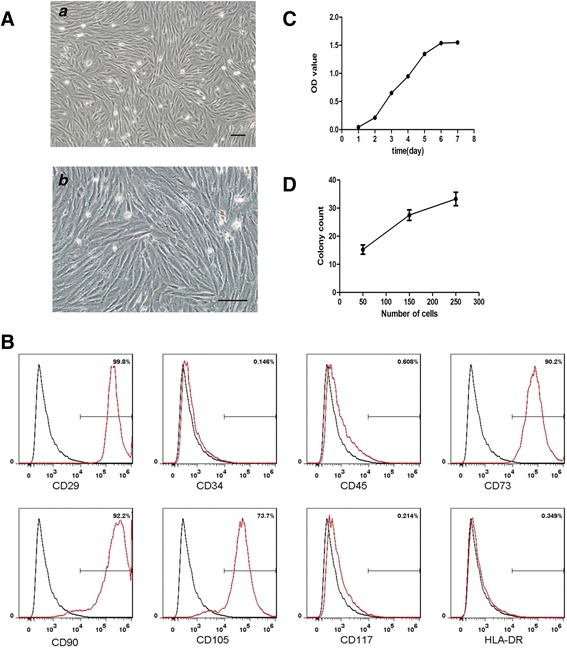
Identification of MenSCs. A Representative images of MenSCs shown at (a) scale bar = 100 μm and (b) scale bar = 100 μm. B Flow cytometry analysis of the surface markers expressed on MenSCs. C Growth curve of MenSCs by CCK-8 assay. D Colony count of MenSCs after 15 days of culture at 50, 150, and 250 cells per square centimeter