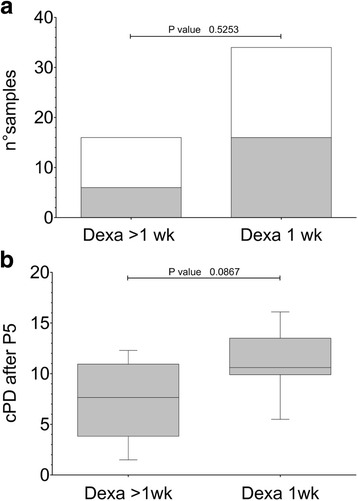
Fig. 1.

Effect of dexamethasone on CB-MSC culture outgrowths. a Effects of two different treatment regimens with DEXA (>1 wk or 1 wk, n = 16 and n = 34, respectively) on CB-MSC isolation (n = 6 and n = 16, respectively). Gray color: positive MSC isolation. White color: negative MSC isolation. The differences were computed by Fisher exact test, p > 0.05. b Comparison of cumulative population doubling (cPD) at P5 between CB-MSC isolated by adding DEXA for > 1wk or 1 wk (n = 6 and n = 15, respectively). The differences were computed by Mann-Whitney U test, p > 0.05. Boxes extend from 25th percentile to the 75th percentile, the middle line represents median value and the whiskers extend from minimum to maximum values. Abbreviations: cPD cumulative population doublings, DEXA dexamethasone, wk week
