Fig. 4.

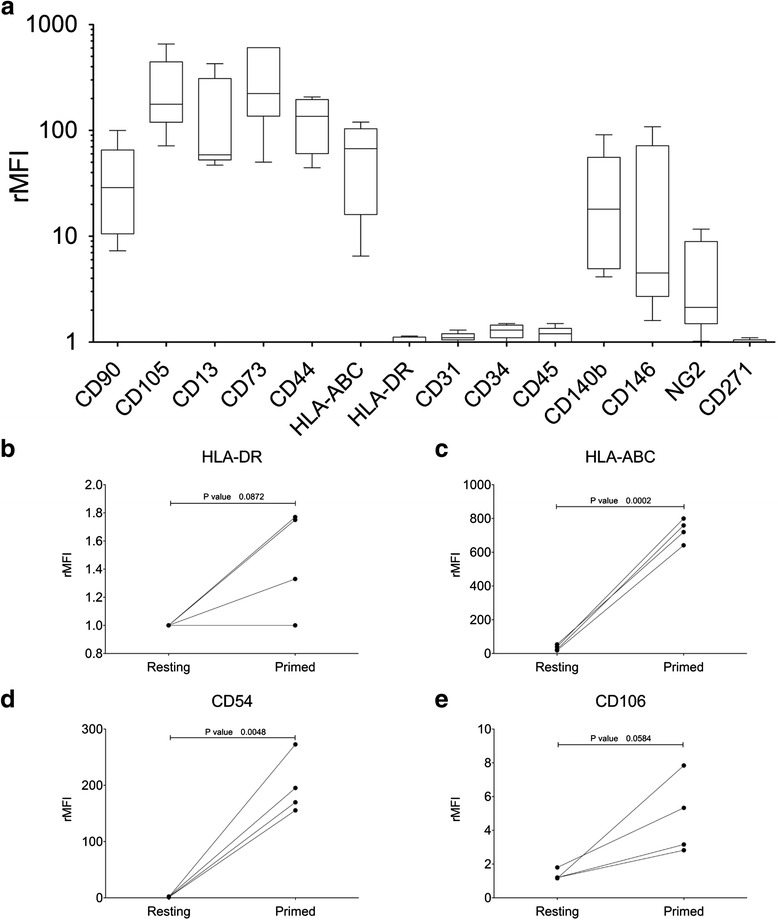
Immunophenotypic analysis of CB-MSC. a Characterization of LL-CBMSC (n = 5) by flow cytometry using a panel of 14 cell surface markers. Boxes extend from 25th percentile to the 75th percentile, the middle line represents median value and the whiskers extend from minimum to maximum values. Data are displayed as rMFI on the unstained control. b-e Phenotypic modifications induced on LL-CBMSC (n = 4) by inflammatory stimuli, i.e., treatment with 10 ng/ml IFN-γ-1b and 15 ng/ml TNF-α for 48 hours before staining with the appropriate mAb combination. Data are expressed as rMFI with respect to the FMO control. P values <0.05 were considered statistically significant. Abbreviations: rMFI relative median fluorescence intensity, FMO fluorescence-minus-one, mAb monoclonal antibody
