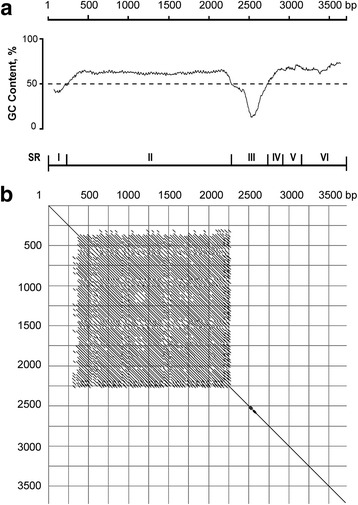
Fig. 3.

GC-content (a) and Harr-plot analysis (b) of nucleotide sequence of 45S IGS of Atropa belladonna (clone Ab-IGS-1S; Acc. No KF492694). A self-comparison of the IGS was made using the following parameters: window = 30, percentage = 70. Borders of structural regions (SR I – SR VI; see Fig. 2) are shown
