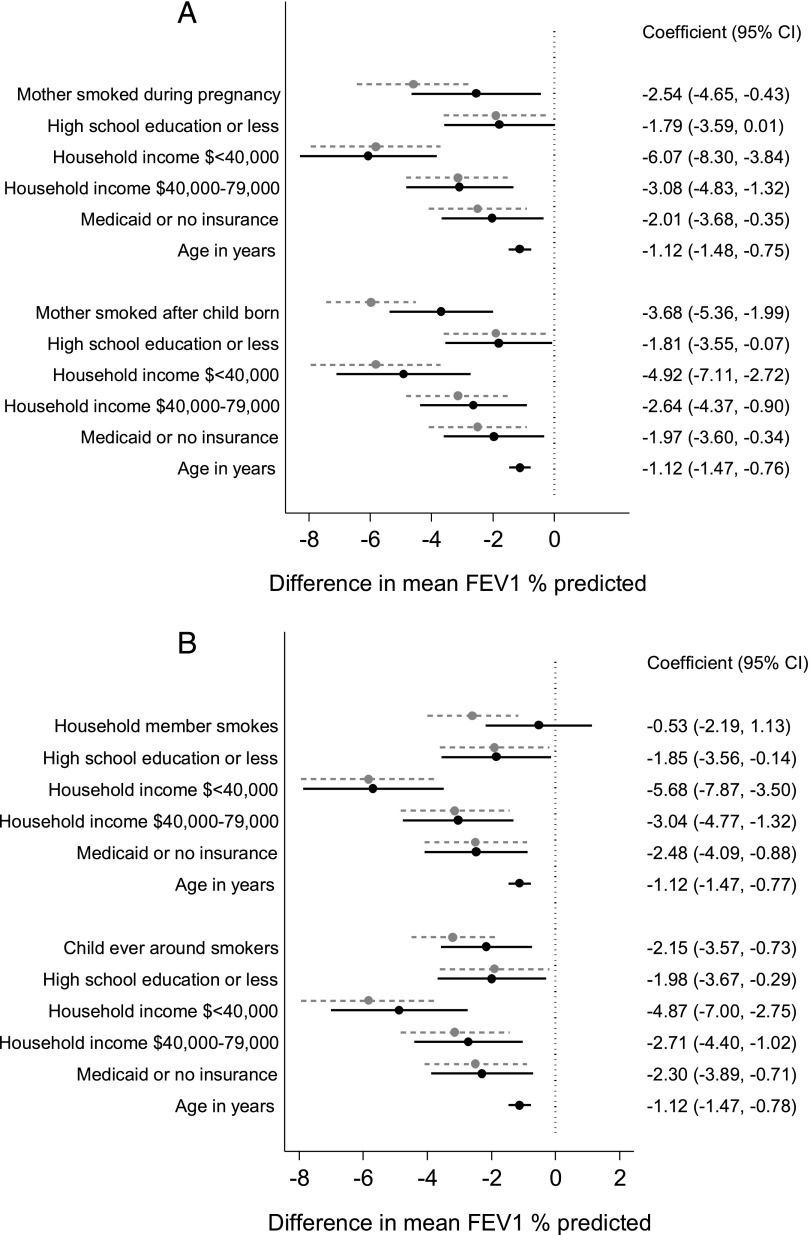
FIGURE 3.
Estimates and 95% CIs (black dots, solid lines) for the difference in mean FEV1 % predicted from multivariable models, including both SES and ETS exposures, and prespecified clinical characteristics. For comparison, gray dots, dashed lines show estimates and 95% CIs from models evaluating SES and ETS exposures separately (Table 2).

