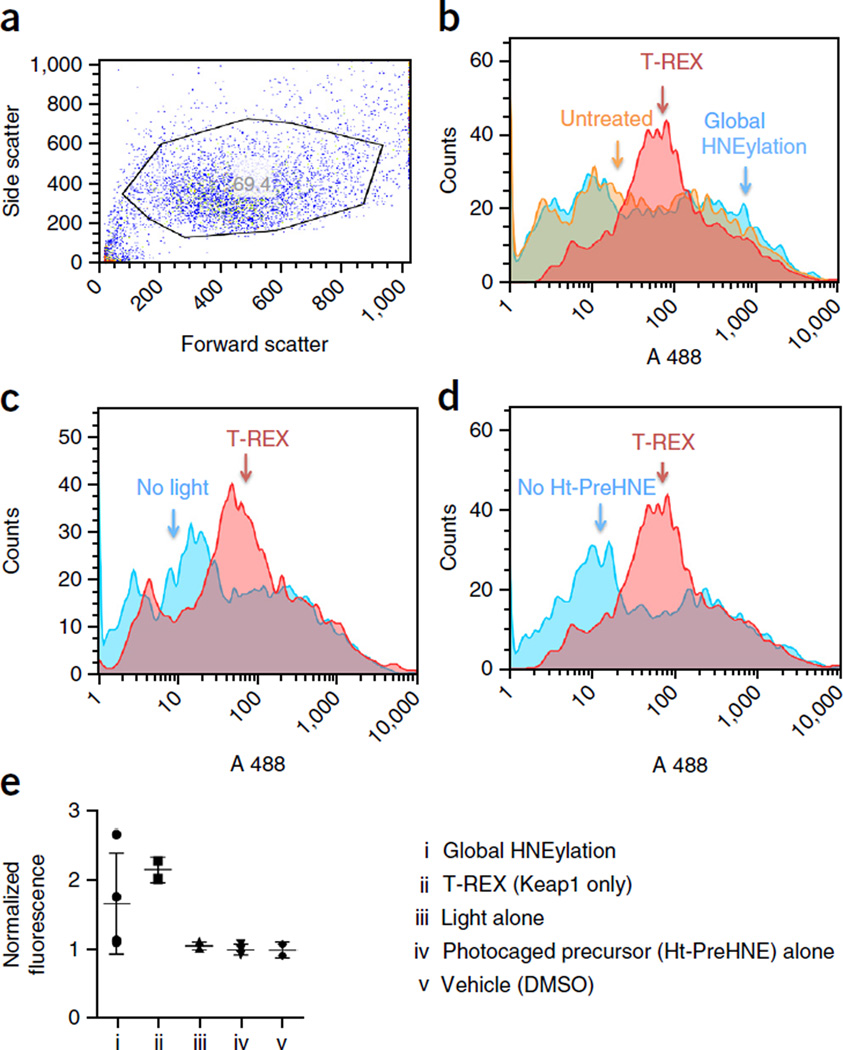
Figure 7.
Flow-cytometry-based ARE-GFP reporter assay quantifying T-REX-mediated activation of antioxidant response in a subpopulation of live HEK-293 cells. (a) Representative GFP expression level in cells transiently transfected with plasmids encoding Halo-Keap1, Nrf2 and ARE-GFP. (b–d) Representative single-parameter (GFP signal) histograms obtained from cells transiently transfected with plasmids encoding Halo-Keap1, Nrf2 and ARE-GFP that have been treated as indicated. (b) Comparison of the results between whole-cell HNE stimulation (blue), T-REX-assisted Keap1-specific activation (red) and no treatment (no photocaged precursor and no light) (orange). (c) Comparison between T-REX (red) and ‘no light exposure’ control (blue). (d) Comparison between T-REX (red) and ‘no photocaged precursor’ control (blue). (e) Representative data from total fluorescence analysis of GFP signal. Error bars designate s.d. (n = 3).

