Figure 3.
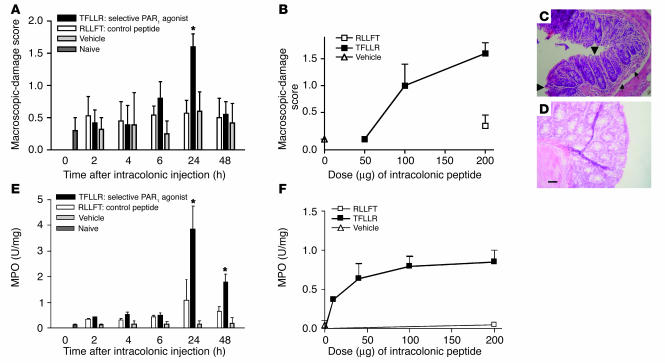
Kinetic and dose-response curves of macroscopic-damage score (A and B) and myeloperoxidase (MPO) activity (E and F) induced by the intracolonic administration of the PAR1-activating peptide TFLLR-NH2, the control peptide RLLFT-NH2, or their vehicle, in C57BL/6 mice. (C and D) Representative H&E-stained histological sections of colons from WT mice that have received an intracolonic administration of TFLLR-NH2 (C) or RLLFT-NH2 (D). Values are mean ± SEM; n = 8 per group. *Significantly different from RLLFT-NH2–treated group, P < 0.05. Dose-response and histological sections were performed at the 24-hour time point after the intracolonic administration of RLLFT-NH2 or TFLLR-NH2. Scale bar: 15 μm (applies to C and D). In C, arrowheads show mucosal erosion, and arrows show submucosal edema.

