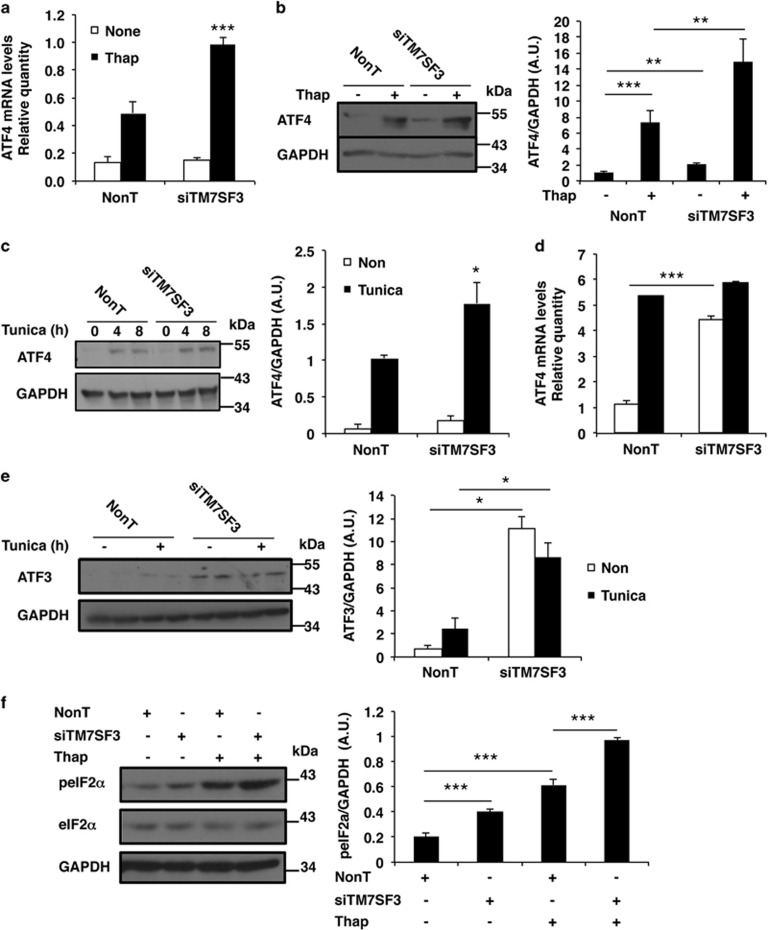
Figure 4.
Effects of TM7SF3-siRNA on ATF3, ATF4 and eIF2α in stress-induced MIN6 and U2-OS cells. MIN6 cells (a–c and f) and U2-OS (d and e) were transfected for 48 h (a–c and f) or for 6 days (d and e) with TM7SF3-siRNA or with a non-targeting sequence. Cells were remained untreated or were treated with thapsigargin (Thap 100 nM) for 16 h (a, b and f); tunicamycin (2 μg/ml) for 4 and 8 h (c); or tunicamycin (2 μg/ml) for 8 h (d and e). RNA (a and d) was extracted and quantified by qRT-PCR. Total cell extracts were resolved by SDS-PAGE and immunoblotted with the indicated antibodies (b, c, e and f, left panels). Quantitation of ATF4, ATF3 and phospho-eIF2α intensities (control versus treatment with tunicamycin (8 h) or thapsigargin (16 h)) is shown as bar graphs (b, c, e and f, right panels). Bar graphs are the mean±S.E.M. of at least three independent experiments in duplicates. *P<0.05; **P<0.01; ***P<0.001 versus non-targeting siRNA assayed under the same conditions

