Figure 3.
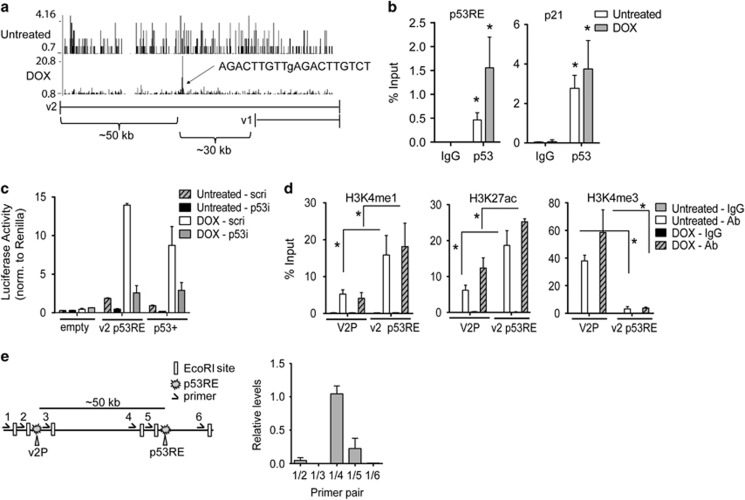
p53 binds to an intragenic enhancer region in TNFAIP8. (a) ChIP-seq analysis in U2OS cells untreated or treated with DOX shows p53 enrichment in the v2 intronic region of TNFAIP8. v1 and v2 genomic locations are shown below (exons depicted as vertical ticks). The p53 binding peak is 50 kb downstream and 30 kb upstream from the v2 and v1 transcriptional start sites, respectively. ‘p53 Scan' software analysis reveals a predicted functional p53 response element (RE), as indicated. Lowercase letter indicates mismatches compared with p53RE consensus (RRRCWWGYYYnRRRCWWGYYY).16 (b) Validation of p53 binding to v2 intronic region was tested by p53 ChIP-PCR (or IgG control) in untreated and DOX-treated U2OS cells (depicted as % of total input DNA). p53 binding to the p21 promoter is shown as positive control. (c) Luciferase activity was measured in untreated or DOX-treated U2OS cells stably expressing scramble (‘scri') or p53-directed shRNA (‘p53i') and transfected with firefly luciferase reporter constructs without (‘empty') or with a 600 bp region encompassing the intronic p53RE region. ‘p53+' is a p53RE-driven luciferase construct (positive control). (d) H3K4me1, H3K27ac, and H3K4me3 ChIP-PCR is shown for the intronic p53RE region (‘v2 p53RE') and the v2 promoter (‘V2P') in untreated and DOX-treated U2OS cells (‘Ab' (antibody)). (e) Schematic showing the 6 EcoRI sites that were used for a three-dimensional chromosome looping assay, as they relate to the v2 promoter region and the intronic p53RE. PCR was performed using the indicated primer pairs in untreated U2OS cells. Results are representative of three or more independent experiments. *P<0.05

