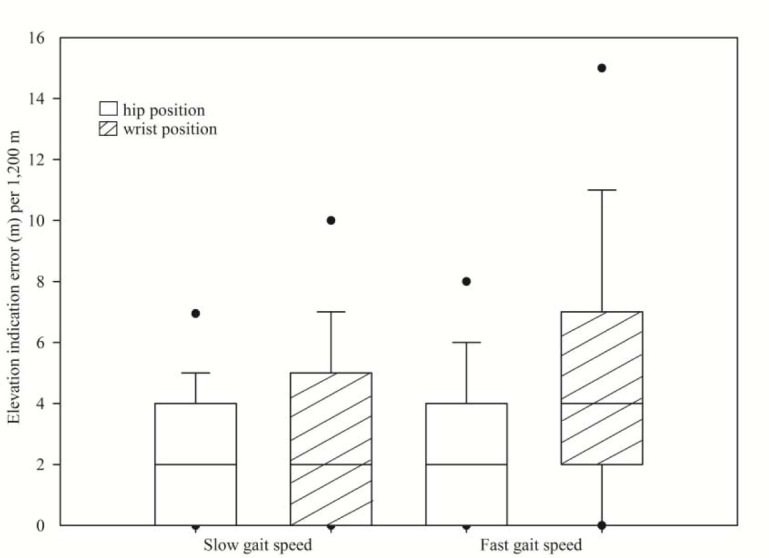
Figure 2.

Data presentation in boxplots separated for slow (strolling and walking) and fast (jogging and running) gait speed according to position on body. For each boxplot the middle line represents the median value, the lower and upper limits represent the interquartile range, the error bars indicate the range and the dots denote the 5th and 95th percentiles.
