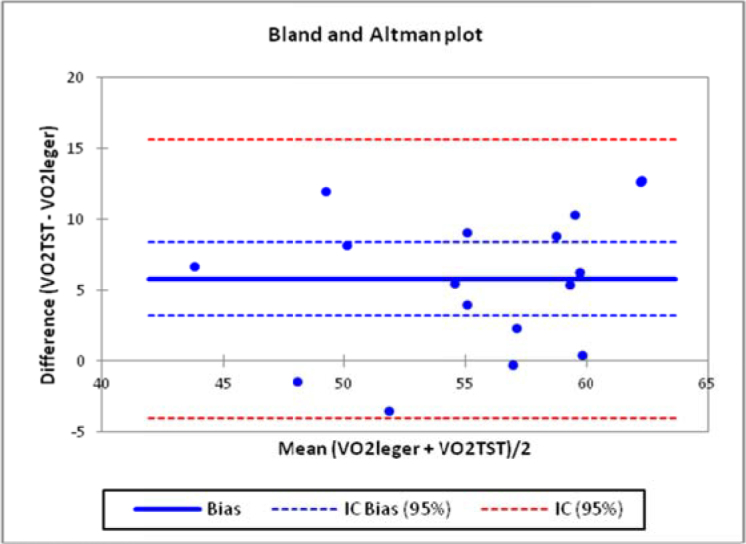
Figure 1.

Bland-Altman graphs comparing VO2 uptake values obtained by the TST and SRT (Léger). The blue solid line represents the mean of the difference (5.8 ml/kg/m in). The dashed red line represents the upper and lower limits for 95% confidence, 15.3 and -3.7, respectively
