Figure 8.
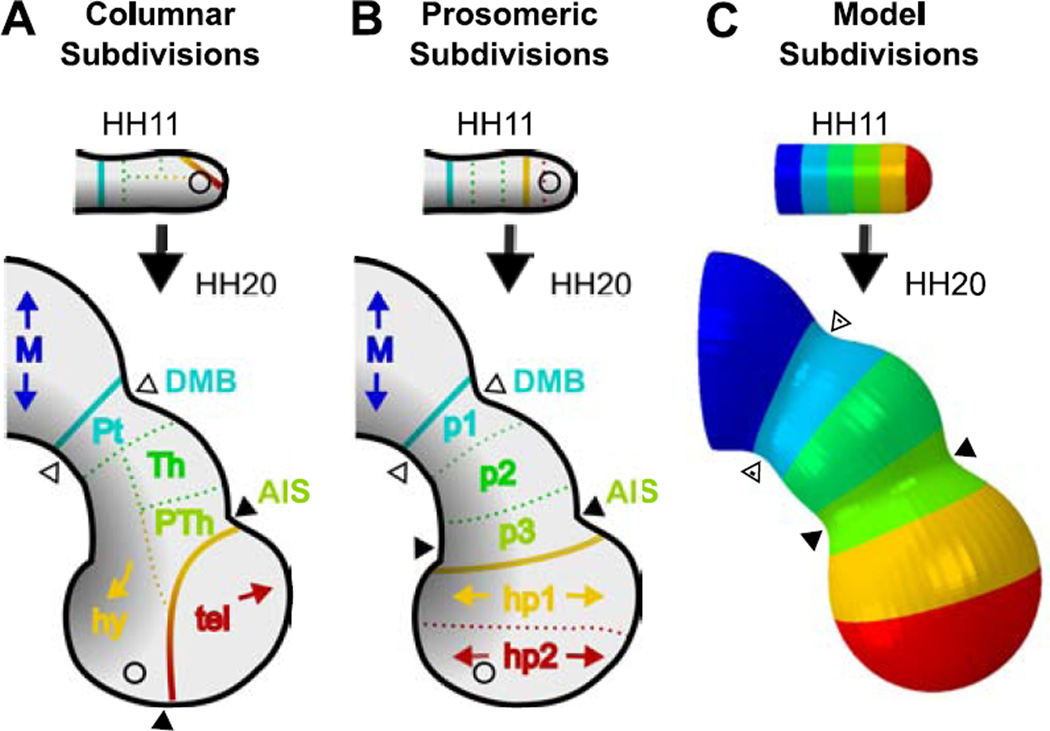
Forebrain regionalization in terms of columnar, prosomeric, and mechanistic subdivisions. (A–B) Proposed functional regions drawn onto forebrain tracings at HH11 and HH20. Black-to-gray gradient represents approximate ventral-to-dorsal signaling (Puelles et al., 2012), regions are denoted by color. Solid lines denote proposed functional boundaries between the diencephalon (middle) and adjacent vesicles, while dotted lines separate regions within each vesicle. Historically accepted columnar subdivisions are shown in (A) (Herrick, 1910), and prosomeric subdivisions (based on signaling patterns and fate mapping) are shown in (B) (Puelles and Rubenstein, 2015). Arrowheads represent expected bounds of physical sulci (black = AIS, white = DMB) for each. (C) Finite element model based on physical observations. Colors represent equally-spaced sections along the rostral-caudal axis at HH11. In this mechanistic model, physical sulci form in regions of circumferentially aligned actin, matching prosomeric regions p1 and p3. Bending of the BT and bulging of the hypothalamus result from constrained growth (constrained by the notochord). Vesicle inflation results from eCSF pressure and stress-dependent growth. M=midbrain, p1=Pt=pretectum, tel=telencephalon, hy=hypothalamus, Th=thalamus, PTh=prethalamus, hy=hypothalamus, p1–p3=diencephalon (prosomeric), hp1–hp2=secondary prosencephalon (SP, prosmeric). Circles represent location of optic stalk.

