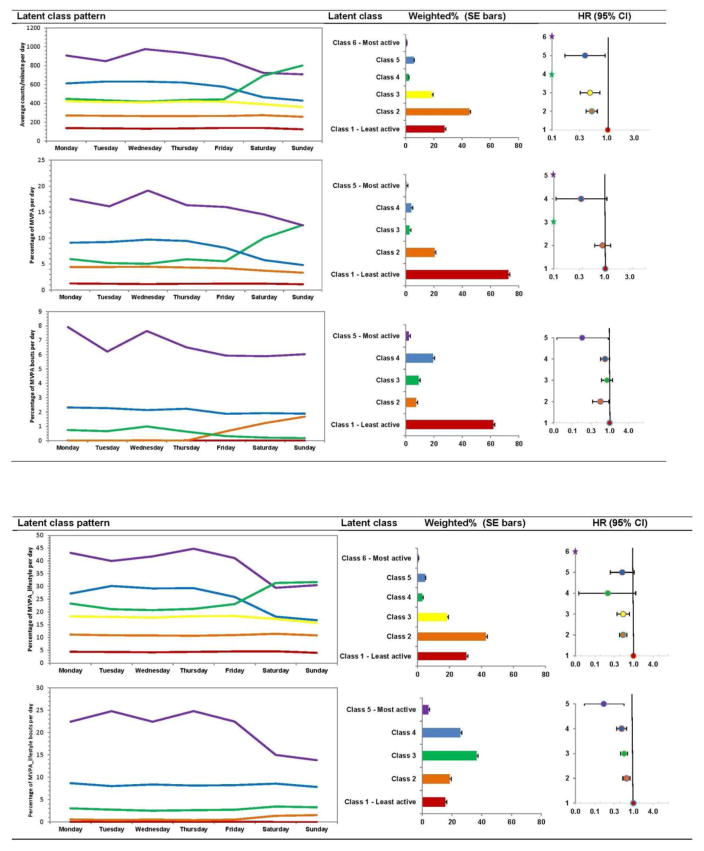
Figure 1.
Weighted percent of latent class assignments of physical activity and corresponding adjust hazard ratios for all-cause mortality; NHANES 2003–2006 (N=4,510).
Notes: The HRs are plotted on the natural log scale. The numbers corresponding to the plotted weighted percents are in Appendix Table 1 and the HR corresponds to Model 3 in Appendix Table 3. This model controls for age (40–49, 50–59, 60–69, ≥70), gender, race/ethnicity (non-Hispanic white, non-Hispanic black, other), education (<high school, high school or GED, >high school), married (yes, no), cigarette smoking (never, former, current), current employment (yes, no), current employment * follow-up time, need special equipment to walk (yes, no), arthritis (yes, no), cancer (no, non-melanoma skin cancer, any other type of cancer), angina (yes, no), myocardial infarction (yes, no), stroke (yes, no), coronary heart disease (yes, no), congestive heart failure (yes, no), BMI (underweight, normal weight, overweight, obese class 1, obese class II/III), BMI categories * follow-up time, hypertension (no, prehypertension, yes), and diabetes (no, prediabetes, yes). The models on MVPA and MVPA bouts also controls for light activity and sedentary behavior. The latent class variable for average counts/minute did not control for other physical activity/sedentary behavior components.
Star indicates no death observed in this category.
The latent class patterns come from Evenson et al., 2015 (4).
HR, hazard ratio; MVPA, moderate to vigorous physical activity; NHANES, National Health and Nutrition Examination Survey

