
Figure 3.
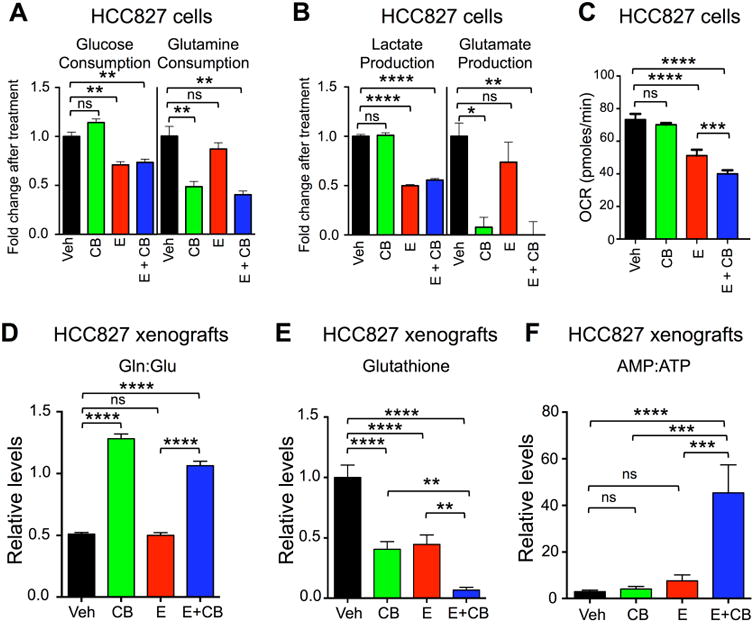
Combination Erlotinib and CB-839 treatment induced energetic stress.
(A and B) Metabolite analysis of HCC827 cell line treated with Vehicle (Veh, black bar), CB-839 (CB, green bar), Erlotinib (E, red bar) and Erlotinib + CB-839 (E + CB, blue bar). Fold change in metabolites relative to Vehicle are plotted for (A) Glucose and Glutamine consumption, and for (B) Lactate and Glutamate production. (C) HCC827 cell line was treated as in (A and B) and oxygen consumption rate (OCR) was measured. (D-F) Pooled metabolites were extracted from tumors following treatment and quantified using LC/MS. Treatments included Vehicle (black), CB-839 (CB) 200 mg/kg/bid/p.o. (green), Erlotinib (E) 12.5 mg/kg/qd/p.o. (red), Erlotinib + CB-839 (E+CB) (blue) (D) CB-839 increases glutamine-to-glutamate ratio in vivo. (E) CB-839 and Erlotinib decrease levels of glutathione in vivo. (F) Combination of Erlotinib and CB-839 leads to increase in AMP-to-ATP ratio in vivo.