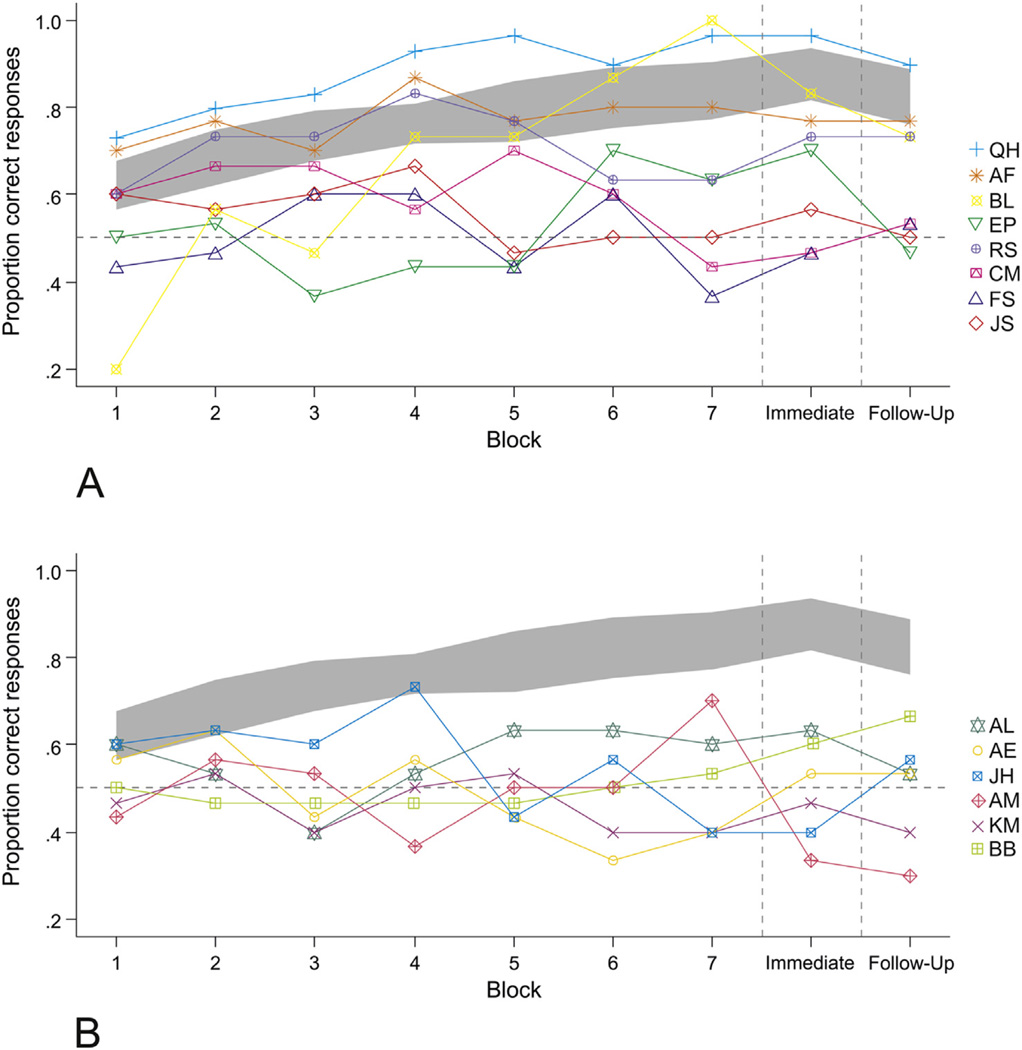
Fig. 5.
Individual variability in performance across learning and recognition testing blocks. Panel A and B depict the individual performances of participants with spared frontal region and participants with damaged frontal region respectively. Panel B also includes the learning performance of participant BB with a right hemisphere stroke. The individual learning curves of the participants with aphasia are displayed over the seven learning blocks with online feedback, and the immediate and follow-up recognition test blocks without feedback. The gray ribbon shows 95% confidence interval for the matched control participants (computed by nonparametric bootstrap) for comparison.

