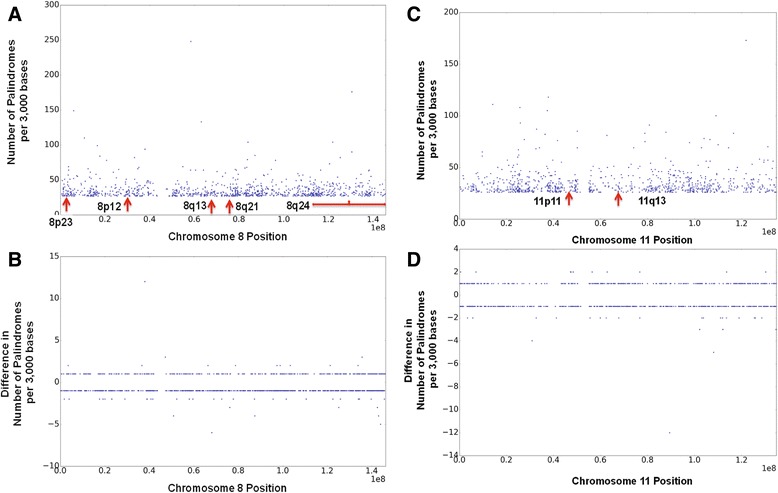
Fig. 1.

Regions that have highest density of palindromes. The number of the palindromes per 3000 bases is computed. The top 2% of the windows that are most dense with palindromes are shown for chromsomes 8 and 11 in (a) and (c). Corresponding numbers were computed for one of the TCGA samples, and the difference with respect to reference genome (tumor – reference) are shown in (b) and (d)
