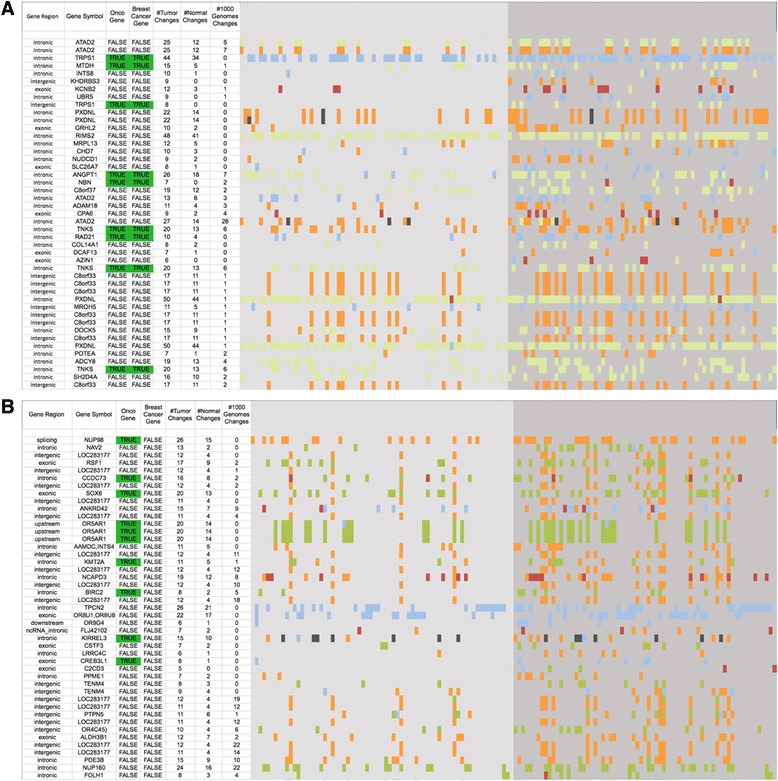
Fig. 2.

List of Palindromes. List of palindromes in (a) chr8 and (b) chr11 with significant changes in tumor and normal samples in TCGA brca dataset and minimum changes in 1000 Genomes with the following color coding: absence of the palindrome (orange), bigger than in the reference genome (pale blue), smaller than in the reference genome (pale green), perfect palindrome in the reference genome which is now a near palindrome with a single mismatch the central eight bases (dark grey) and palindrome that had the same length as in the reference genome but had a variant (burgundy). The left side of the figure represents normal samples and the right side tumor samples. Oncogenes and/or brca genes are highlighted in green
