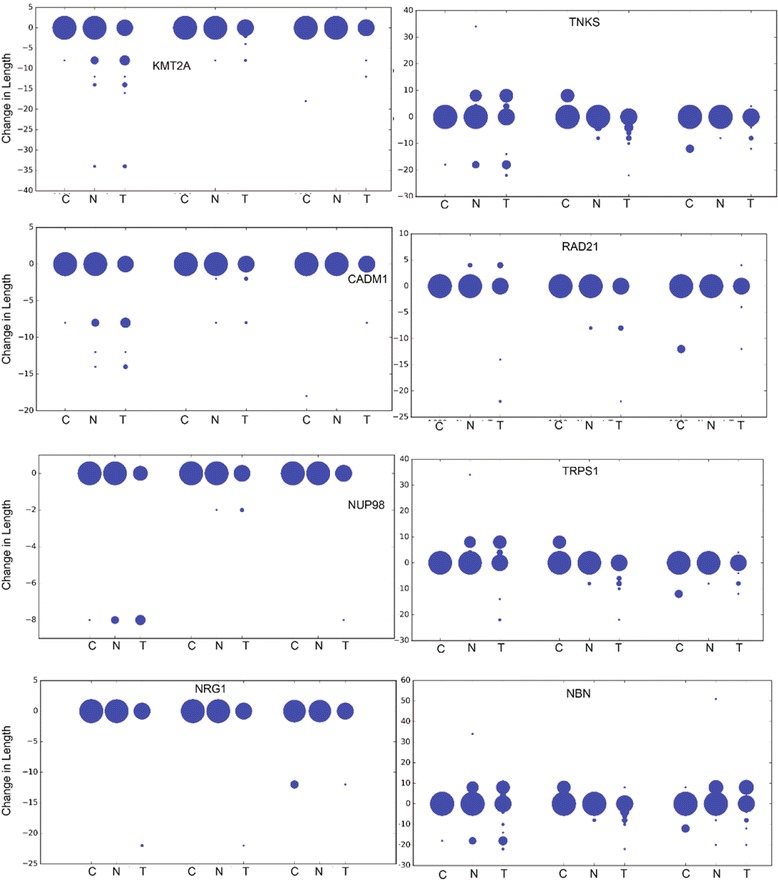
Fig. 3.

Changes in specific palindromes in eight genes. Three palindromes that have changed most significantly are shown for eight genes (KMT2A, TNKS, CADM1, RAD21, NUP98, TRPS1, NRG1 and NBN). For each palindrome of any gene, its difference in the length in comparison to reference genome are shown separately for 1000 g, normal and tumor genomes. The size of the circle is proportional to the number of samples out of the 69 considered in each set. C represents Control, N represents Normal and T represents Tumor in the figure
