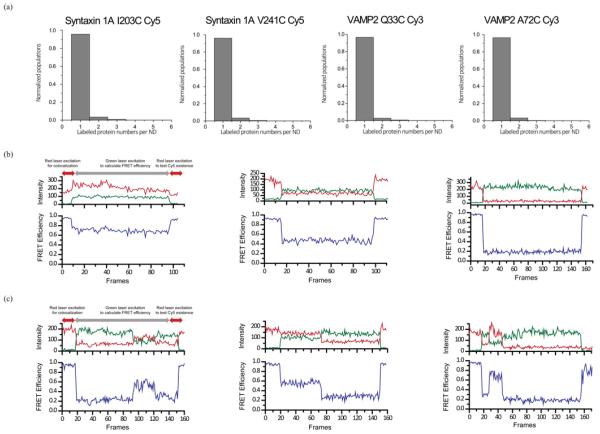
Figure 2. smFRET for nanodisc sandwiches with SNAREs.
(a) Photobleaching experiment to confirm the number of labelled SNARE proteins in a single nanodisc. Distribution of Syn1A I203C–Cy5, Syn1A V241C–Cy5, VAMP2 Q33C–Cy3 and VAMP2 A72C–Cy3, from left to right. (b) Representative FRET traces from nanodisc sandwiches for high, mid and low FRET, from left to right. (c) Representative fluctuating FRET traces from nanodisc sandwiches for low–high–low, high–low and low–high–bleached FRET, from left to right. Such traces are rarely observed (<2%). The samples were initially excited with a red laser in order to find co-localized FRET pairs. The FRET efficiency of the specimen was calculated from the region depicted by grey arrows.

