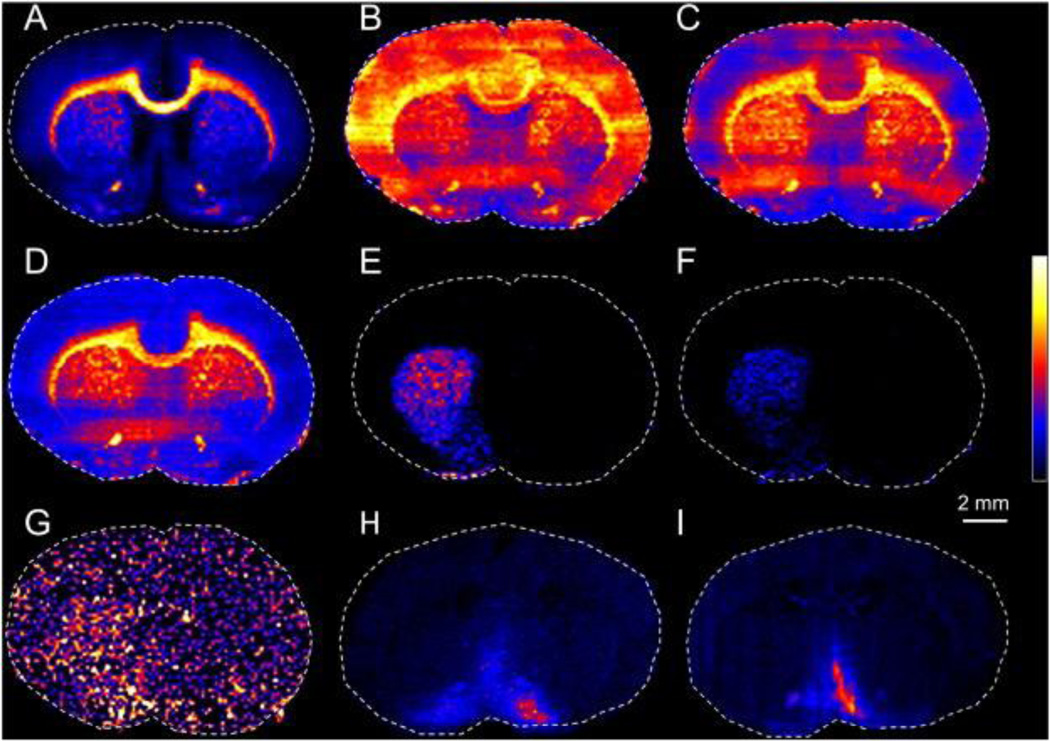
Figure 3.
DESI-MS images of neurotransmitters in coronal rat brain tissue sections. DESI MSI ion intensity maps of (A) adenosine m/z 302.0667, (B) aspartate m/z 132.0304, (C) glutamate m/z 146.0461, (D) glutamine m/z 145.0621, (E) DA m/z 152.0719, (F) D3-DA m/z 155.0908, and (G) DOPAC m/z 167.0352 acquired in negative ionization mode. (H) The GABA molecular ion image m/z 104.0709 and (I) GABA MS/MS product ion image (m/z 87.0445) were acquired in positive ionization mode. Scale bar: 2 mm; spatial resolutions: (A–G, I) 150 µm and (H) 110 µm. Reprinted with permission from Neuroimage, 136, Shariatgorji, M.; Strittmatter, N.; Nilsson, A.; Källback, P.; Alvarsson, A.; Zhang, X.; Vallianatou, T.; Svenningsson, P.; Goodwin, R. J. A.; Andren, P. E., Simultaneous imaging of multiple neurotransmitters and neuroactive substances in the brain by desorption electrospray ionization mass spectrometry, 129–138 (ref 66). Copyright 2016, with permission from Elsevier.

