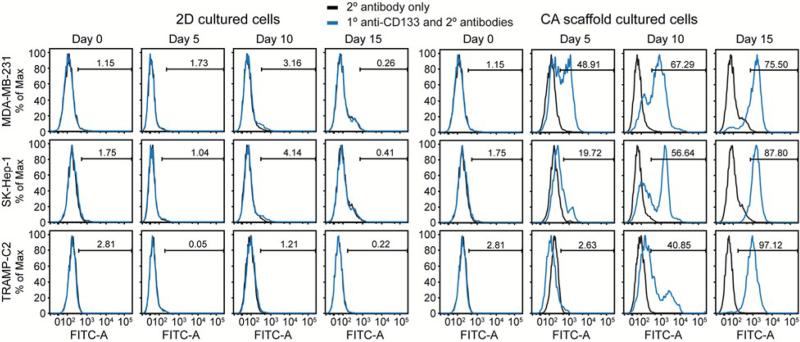
Figure 4.
Flow cytometry histograms for 2D and CA cultured cells for CD133 expression. Cells were cultured on 2D culture plates or in CA scaffolds for 0, 5, 10, and 15 days before staining for CD133 and analyzing with flow cytometry. Low levels of CD133+ cells were observed at each time point for 2D (left) and enrichment of CD133+ cells was observed at increasing time points for CA (right).

