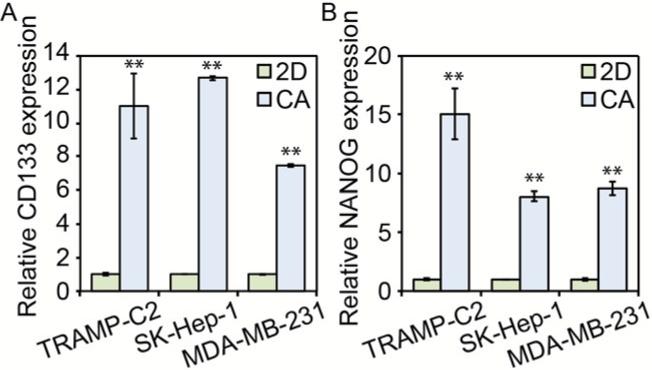
Figure 6.
PCR data for stem cell marker expression prostate, liver, and breast cancer cells. Both A) CD133 and B) NANOG expression were considerably higher in prostate cancer (TRAMP-C2), liver cancer (SK-Hep-1), and breast cancer (MDA-MB-231) cells cultured for 10 days in CA scaffolds than those in 2D plates, ** indicates p < 0.01. Expression of CD133 or NANOG mRNA was normalized to B-actin and the 2D culture condition.

