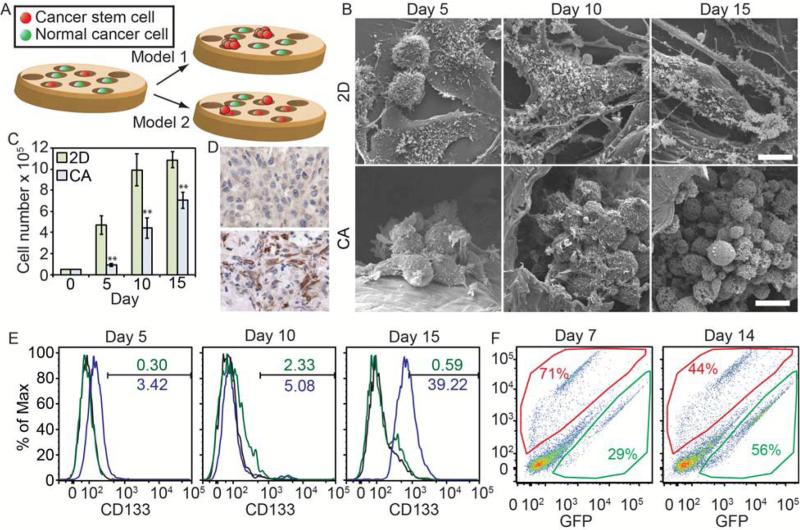
Figure 7.
Mechanism for CSC enrichment in CA scaffolds. A) Putative models for CSC enrichment in CA scaffolds. Model 1 indicates that only the CSCs are able to grow within the scaffold. Model 2 indicates that CSCs grow within the scaffold and that the scaffold promotes the de-differentiation of non-CSCs into CSCs. B) SEM images of U-87 MG human glioblastoma cells growing on 2D surfaces and CA scaffolds showing their growth is similar to other cancer types. Scale bars represent 10 μm. C) U-87 MG cells grown on CA scaffolds have a delayed growth profile suggesting the cells must adapt to the CA scaffold environment before proliferating, ** indicates p < 0.01. D) Histological analysis of CD133 expression in tumors from mice implanted with U-87 MG cells from 2D (top) or CA (bottom) culture. Tumors from 2D precultured cells showed very little staining for CD133 (brown) whereas tumors from CA precultured cells showed large amounts of staining. E) Flow cytometry analysis of proportion CD133+ U-87 MG cells grown on 2D (green) or in CA scaffolds (blue) over 15 days. F) Flow cytometry analysis of CA scaffold preconditioned (RFP+, red) and naive (GFP+, green) glioblastoma cell co-cultured samples collected from CA scaffolds after 7 and 14 days of culture. Preconditioned cells initially grew more rapidly within the scaffolds, but eventually even numbers of naïve and preconditioned cells were present.

