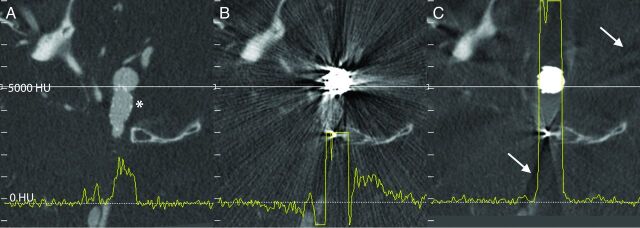
Fig 3.
Corresponding axial sections of VasoCT data acquired after stent placement (A, stent indicated by asterisk) and after coil embolization (B and C). Streak artifacts generated by the coil mass visible in VasoCT data without MAR (B) are severely reduced with MAR (C). Because of the replacement of absent data in the raw projections, subtle new artifacts appear in VasoCT with MAR (C, arrows). Intensity profiles (yellow lines) were generated for all 3 images by use of the same physical coordinates (white lines). The intensity scale of the profile analysis is given on the left-hand side of the figure. Profile plots show that severe fluctuations outside the coil mass are reduced by MAR and the resulting profile in C is similar to the profile in A.

