Figure 4.
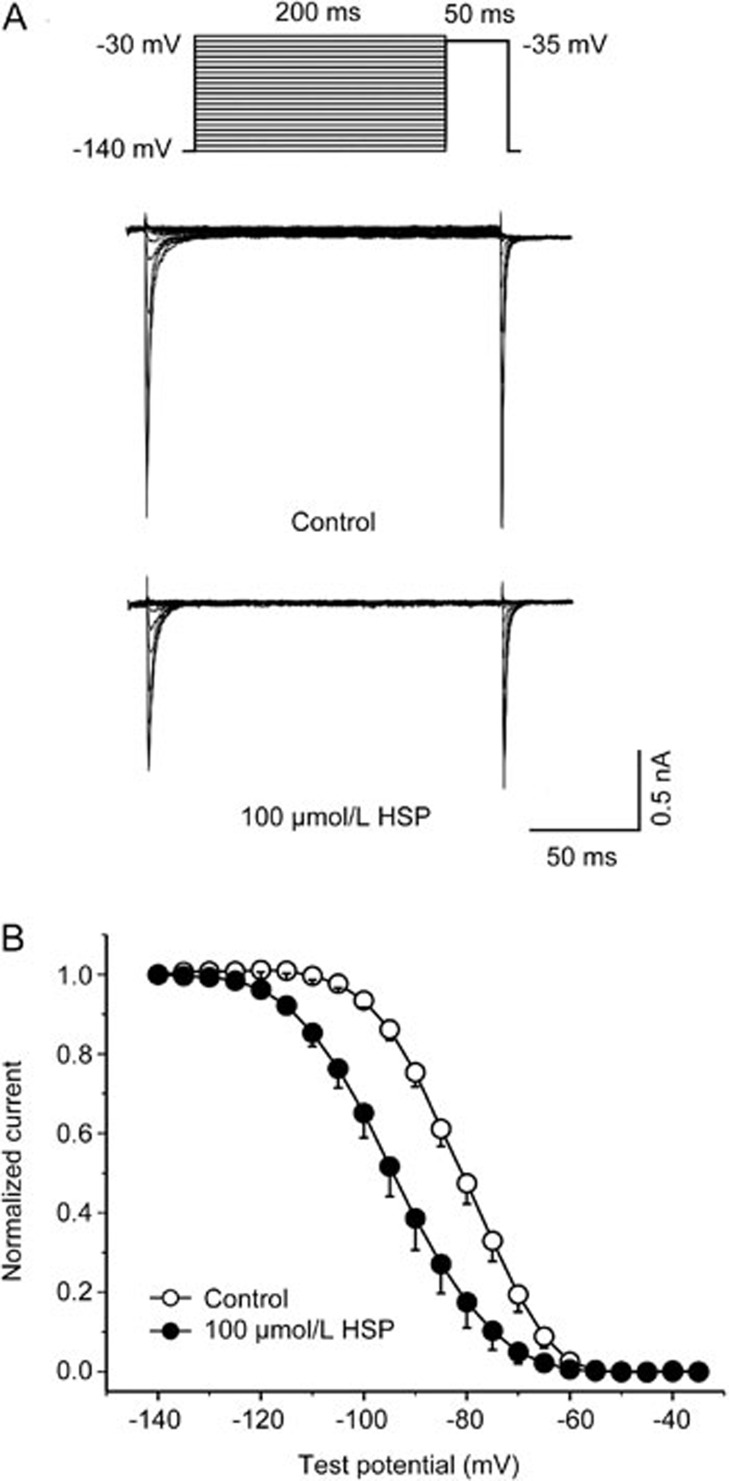
Effects of hesperetin on steady-state Nav1.5 channel inactivation. (A) Representative traces showing the steady-state inactivation of Nav1.5 currents. These traces were obtained using 200-ms pulses causing depolarization increasing in steps of 5 mV from a holding potential of −140 mV to a potential of −30 mV, followed by 50-ms pulses causing depolarization increasing at 5 s intervals from a holding potential of −140 mV to −35 mV. (B) The steady-state Nav1.5 current inactivation curves were fitted to the Boltzmann equation. The plots represent normalized mean currents during the test pulse as a function of the conditioning potential (n=9, P<0.01). Data are expressed as the mean±SEM.

