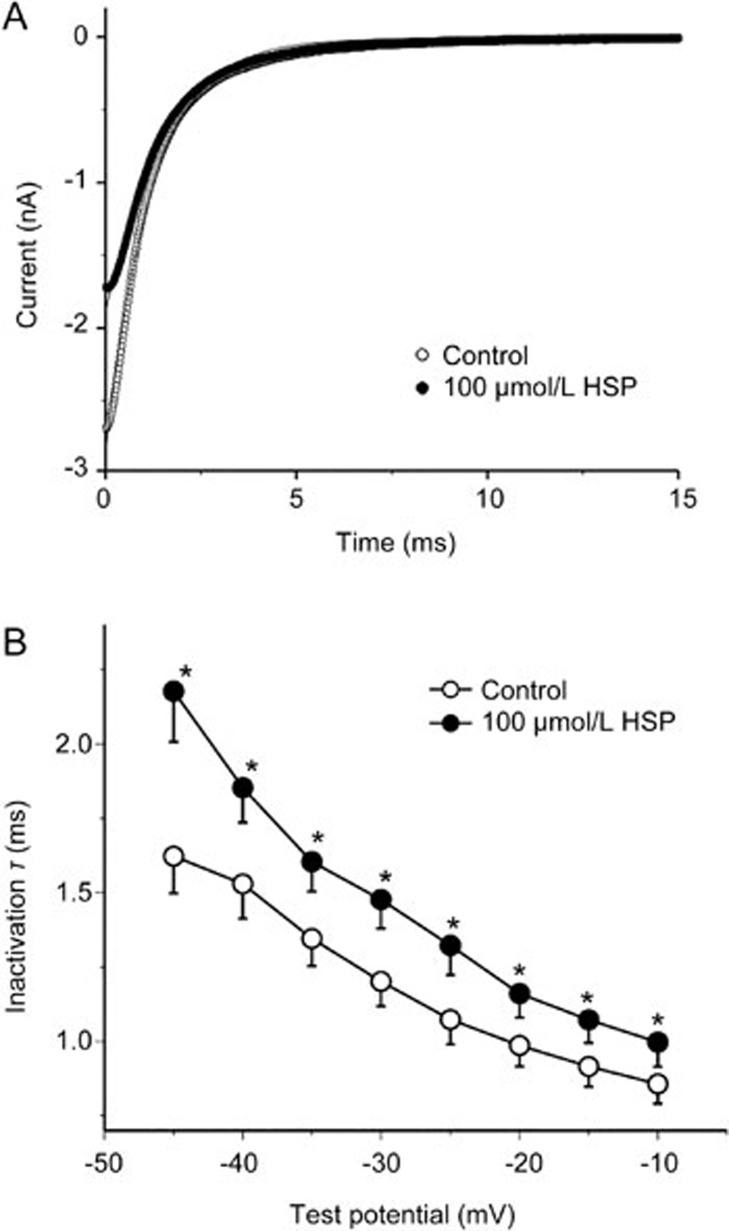
Figure 5.
Effects of hesperetin on the time constants of Nav1.5 channel inactivation. (A) Representative traces showing the original plots of Nav1.5 current inactivation and the curve fitted by a mono-exponential function before and after 100 μmol/L hesperetin treatment at a potential of −35 mV (n=9). (B) The time constant (τ) of inactivation (from the peak to the end of the depolarizing pulse) measured by fitting the single-exponential function is plotted against different voltages. Mean±SEM. n=9. *P<0.05 vs control. HSP: hesperetin.

