Figure 2.
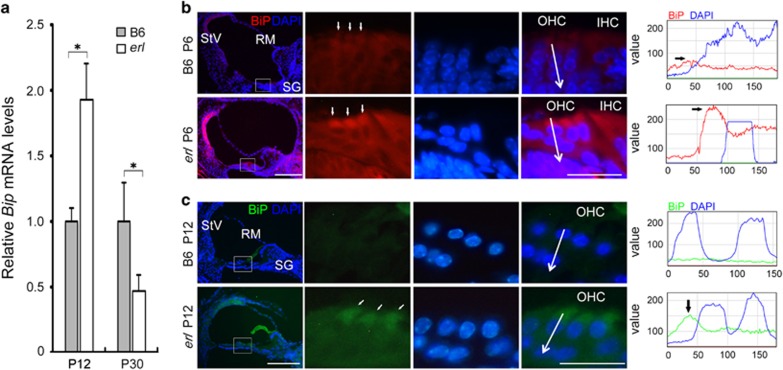
BiP expression in the B6 and erl mouse cochleae. (a) The Bip mRNA levels in the cochleae of the B6 and erl mice at P12 and P30. The Bip mRNA level was significantly higher in the erl mice at P12 but decreased at P30, compared with the B6 cochleae. The error bars represent S.E.M. (*P<0.05, n=3 mice, t-test). (b,c) The BiP showed higher intensities in the StV, SG and especially OHCs of the erl mice, forming a hat-like pattern on the top of the OHCs' nuclei at P6 and P12. A line intensity analysis revealed that the BiP signals were expressed in the OHC area of the erl cochleae (n=4 mice per group). Scale bars, 50 μm (left); 20 μm (right)

