Figure 1.
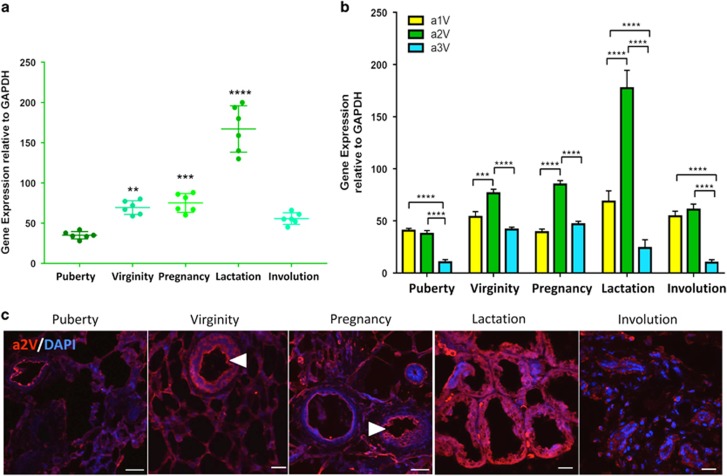
a2V expression during normal mammary development. Inguinal mammary glands from puberty, virginity, pregnancy, lactation and involution stages were harvested and analyzed for gene expression and cellular distribution of a2V. Total RNA extracted from mammary glands was subjected to quantitative real-time-PCR (qRT-PCR) analysis. (a) Gene expression of V-ATPase ‘a2' subunit isoform during various stages of gland development compared with puberty. (b) Relative gene expression of V-ATPase a1, a2 and a3 subunit isoforms compared with each other at every stage. Glyceraldehyde 3-phosphate dehydrogenase (GAPDH) served as endogenous housekeeping control. Data represent mean±S.E., n=6. *P≤0.05, **P≤0.01, ***P≤0.001 and ****P≤0.0001. (c) Representative z-stack images from a confocal laser-scanning microscope show expression pattern of V-ATPase ‘a2' subunit isoform (a2V in red). Nucleus was stained with DAPI (diamidino-2-phenylindole; blue). Scale bars: 20 μm

