Figure 4.
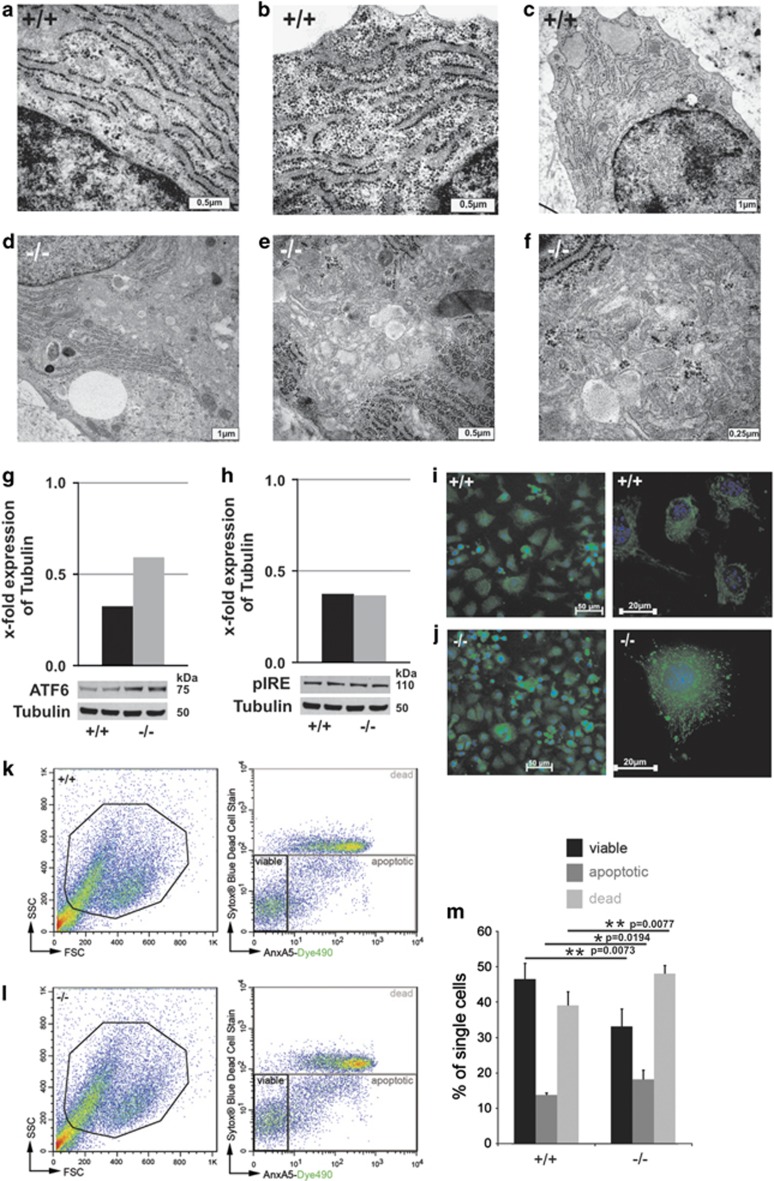
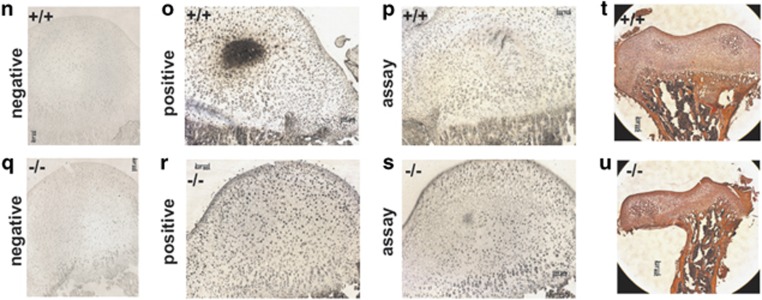
Perturbed proteostasis, UPR, ER stress and apoptosis in primary smpd3−/− chondrocytes. (a-c) EM displays regular rER in control chondrocytes and (d-f) dilated and giant ER cisternae in smpd3−/− chondrocytes, N=3. (g and h) WB of control and smpd3−/− chondrocytes of ATF6 and pIRE, N=3. (i and j) Annexin V staining of control and smpd3−/− chondrocytes. Flow cytometry of single-cell primary chondrocytes from control (upper panel) and smpd3−/− (lower panel) mice, using AnxA5-Dye490 and SYTOX Blue Dead Cell Stain. Representative dot plots are shown. (k) Cell debris were excluded according to size (FSC) and granularity (SSC), followed by gating of single cells (data not shown). (l) AnxA5(-)/Sytox Blue(-) viable, AnxA5(+)/Sytox Blue(-) apoptotic and AnxA5(+)/Sytox Blue(+) dead cells were detected. (m) Mean percentage of AnxA5(-)/Sytox Blue(-) viable, AnxA5(+)/Sytox Blue(−) apoptotic and AnxA5(+)/Sytox Blue(+) dead cells ±S.D. is given for control (+/+) and smpd3−/− animals, N=4. TUNEL assay in sections of radial epiphysis. (n and q) negative control, (o and r) positive control and (p and s) assay of control and smpd3−/− chondrocytes, N=4. (t and u) Light microscopy of HE–stained paraffin sections (5 μm) of decalcified tibial epiphysis of control and smpd3−/− mice (4mo), N=4


