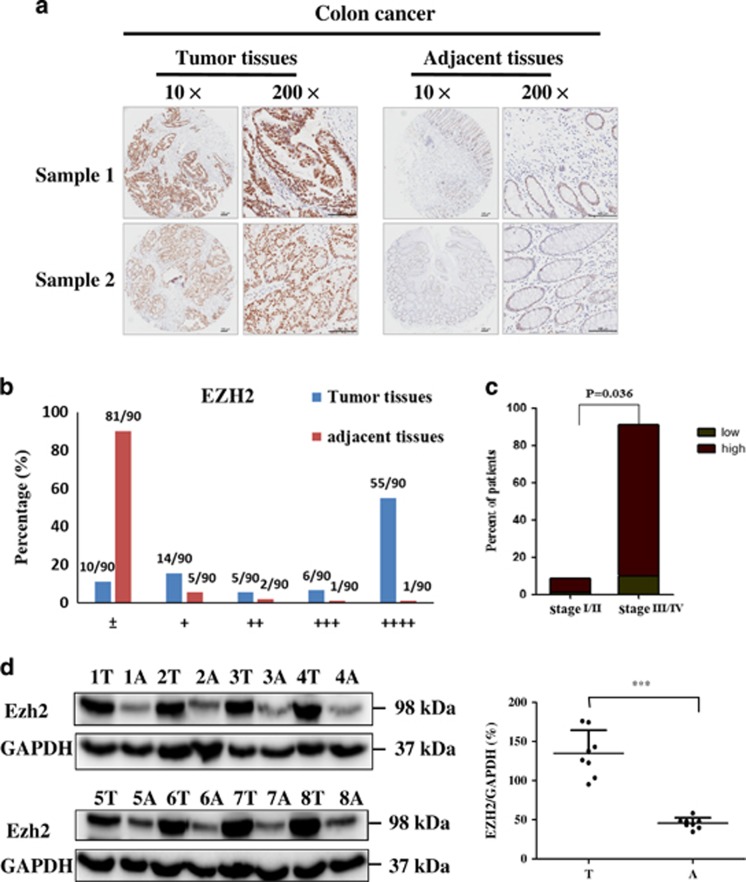
Figure 1.
Expression of EZH2 in human colon cancer tissues. (a) IHC staining of EZH2 in both tumoral (left) and adjacent (right) tissues from two representative samples on the tissue array. Different magnification from the same sample was shown (scale bar: 100 μm). (b) Based on the EZH2 staining intensity, five groups were classified and plotted from the weakest (±) to the strongest (++++) in both tumoral and adjacent tissues on the tissue array (n=90), as described in Materials and methods section. (c) High EZH2 expression was correlated with TNM stage (III/IV versus I/II) (P<0.05) in the samples according to their clinicopathologic features listed in Supplementary Table 1. (d) IB analysis of EZH2 expression in eight pairs of colon cancer and adjacent normal tissues from patients. GAPDH was used as a loading control. Quantification of the protein expression in the tumor (T) and adjacent tissues (A) was analyzed on the right (n=8) (***P<0.001)

