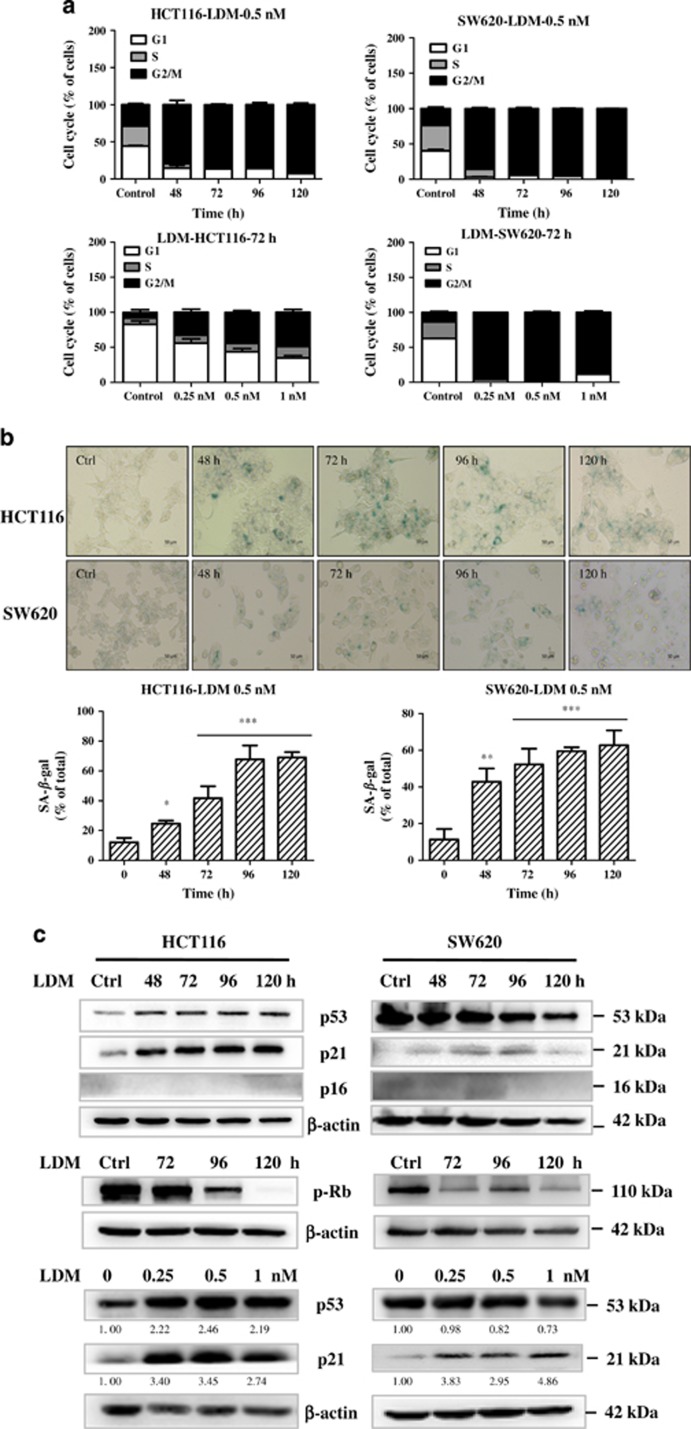
Figure 3.
LDM induced growth arrest and senescence in the colon cancer cells. (a) Cell cycle distribution upon LDM treatment in both time- and dose-dependent manner as indicated. The data were representative from three independent experiments. (b) LDM-induced senescence in the cells. The cells were treated with 0.5 nM LDM for the indicated time and analyzed with SA-β-Gal staining and quantified (× 20). The data were expressed as the means±S.D. of three independent experiments (*P<0.05, **P<0.01, ***P<0.001 versus control). (c) LDM affected the molecular expression of proteins involved in senescence regulation. The cells were treated either with 0.5 nM LDM for the indicated time, or with different doses of the drug for 72 h, and then subjected to IB analysis using respective antibodies. β-Actin served as a loading control. The relative optical density for each band was quantified, normalized and labeled under each lane

